Do you think Batman belongs only on movie screens?
Then, you’ll be surprised to learn that there’s actually a chart pattern that’s been named after Gotham’s favorite superhero.
Granted, it’s not as famous or well-known as the head and shoulders or the double tops and bottoms, but the Batman chart pattern is still a pattern worth discussing.
So, we’re going to do that.
Read along, if you’re interested, and let’s explore this interesting formation together!
What is the Batman Chart Pattern?
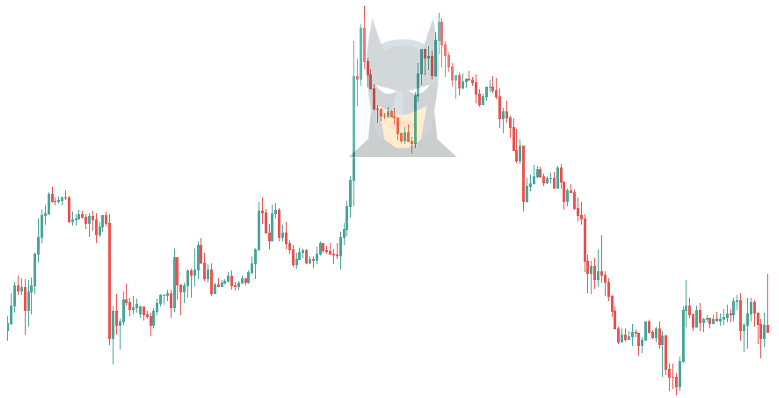
It’s probably difficult to imagine how Batman would look on a forex chart. So, first of all, here’s a glimpse:
As normally happens with chart patterns, there are both a bullish and a bearish version. A bullish pattern indicates that prices will go up, and a bearish pattern indicates that prices will go down.
It’s the bearish pattern that has the Batman-like appearance. The bullish version is basically an inverted Batman, which sounds ridiculous, so let’s instead say it’s Batman performing handstand push-ups.
After all, when you do this exercise you push yourself away from the ground, just like the price is expected to rise from the bottom following the bullish Batman.
Okay, perhaps we’re overthinking it, but you get the idea.
Batman chart patterns are variations on the classic double top and double bottom patterns. There are some notable features that make the Batman pattern as unique as it sounds.
Let’s investigate the bullish and bearish versions of the pattern in more detail and showcase the differences compared to double tops & bottoms.
Bearish Batman Pattern Explained
The bearish Batman pattern is “the Batman pattern.”
It resembles the double top in that it involves two upthrusts that make the “ears.” The key difference compared to the double top is that the Batman forms when there are failed volatility spikes.
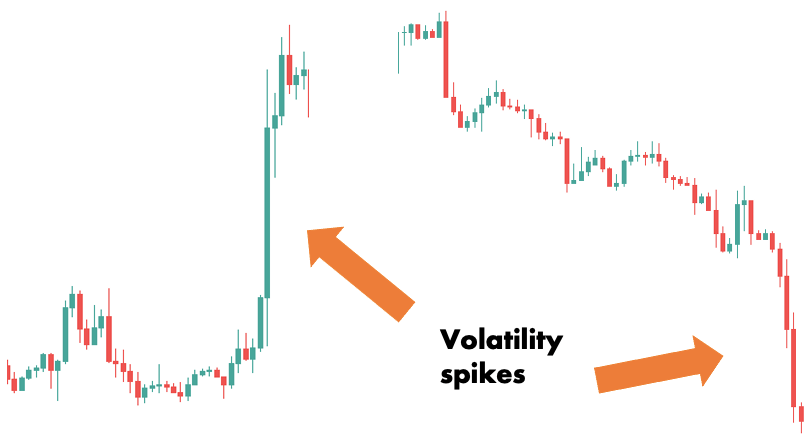
But what the heck is a volatility spike?
A volatility spike is a rapid increase in trading activity that results in a string of huge green or red candles.
This guide belongs to ForexSpringBoard.com. Do NOT Copy.
Volatility spikes can occur at any time of day, but they are most common during the London session and the London-New York overlap.
These are the busiest times of the day, so there are bound to be some surprises that move the market and cause noticeable volatility spikes.
The double top pattern consists of two highs at equal price levels, and that’s it. In contrast, the Batman chart pattern requires that these highs must be volatility spikes.
When the market soars twice in a row but fails to hold the higher prices, the odds of a reversal increase. That’s why the Batman pattern is a powerful reversal indicator.
Volatility spikes occur most frequently on 1-minute charts, so this timeframe is particularly suitable for trading Batman chart patterns.
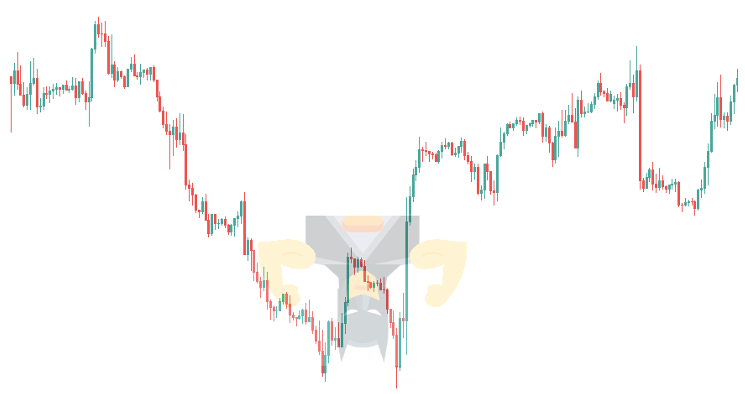
Bullish Batman Pattern Explained
The bullish Batman is the opposite of the bearish Batman.
It is comparable to the double bottom, but instead of producing two bottoms gradually, the bottoms form very quickly due to the increased activity (AKA the volatility spikes we just discussed a little above).
Two failed downswings are a good indication that the market has found a bottom. This can lay the foundation for a long trade.
That’s why traders love to use the bullish Batman to buy the market and speculate on higher prices.
How to Trade Batman Chart Patterns
In this section, we’ll go through how to leverage the Batman chart pattern (both versions) to enter high-probability trades.
Because this is a forex site, we’ll look at currency charts, but the Batman can be used anywhere, so the following suggestions will be beneficial regardless of your preferred market.
Wait for the Batman pattern to occur at support or resistance
The most powerful situation is when the Batman occurs at an important support or resistance.
In case you’re unfamiliar with these terms, a support is an area on a chart where demand is predicted to be greater than supply. A resistance, on the other hand, is an area where supply is predicted to be greater than demand.
(We have an in-depth guide on support and resistance if you’d like to learn more.)
Unfortunately, support and resistance don’t always work, but when you already have a level highlighted on the chart and a Batman pattern appears at the same location, your chances are as good as they get.
Let’s look at an example, starting with the bearish Batman.
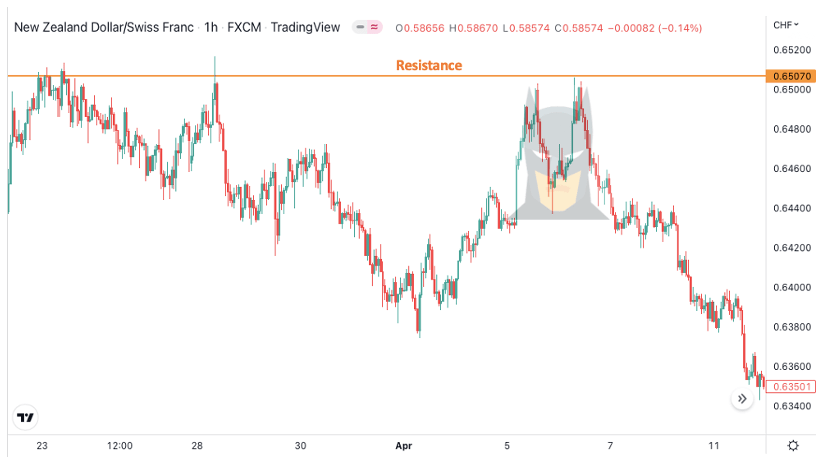
In this case, you can identify the resistance around the end of March on the NZD/CHF hourly chart. Soon, the market turned down from the resistance and began trending downwards.
By early April, however, the market had recovered and, within two days, had formed a nice bearish Batman pattern.
To take advantage of this situation, you could have entered a short position right after the second ear had formed.
The below picture illustrates:
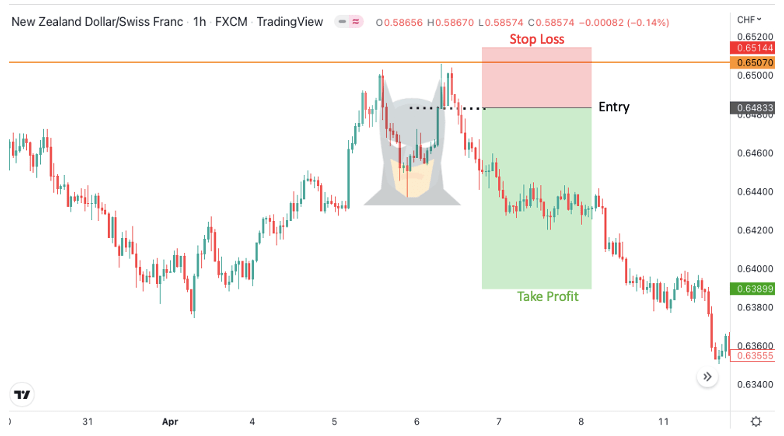
The dotted line marks the low of the ear. The short position is opened when the market falls below this level. The stop loss is placed above the resistance level, and the take profit is three times the amount at risk.
Let’s now take a look at a trade opportunity involving the bullish Batman.
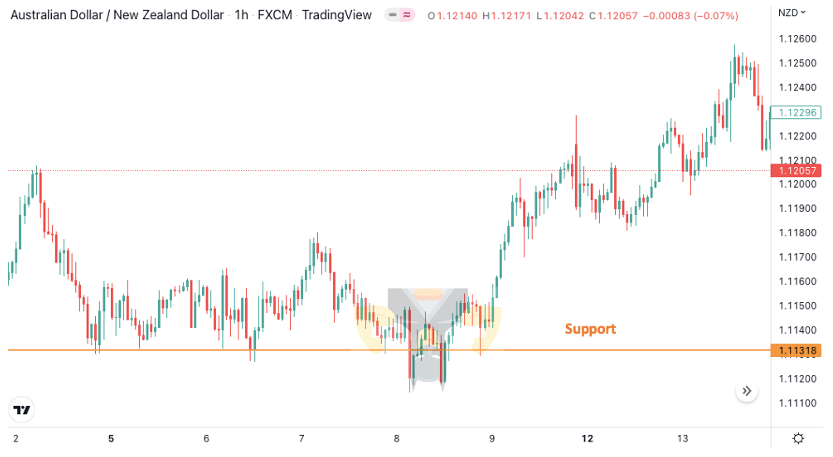
The above picture shows an interesting set-up on the hourly AUD/NZD chart.

As you can see, there’s a strong support level which has kept the market from going lower multiple times.
The bullish Batman developed after sellers led two powerful efforts to break through the support level.
Both times, they were able to drive the price below the level, but new buyers quickly came in to take advantage of the lower pricing, and the market swung back above support.
This indicates that the support level has strong footings and that the market might rise soon. That’s why events like this offer excellent buying opportunities.
For example, you might have opened a long trade immediately when the market returned above support for the second time, or one or two candles later if you prefer to see more confirmation.
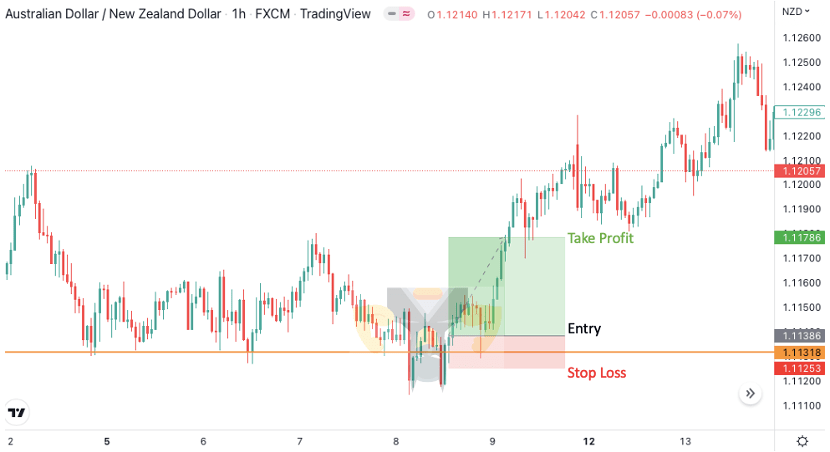
So, this is how you trade the bullish and bearish Batman chart patterns around support and resistance levels. Let’s now look at a different approach.
Combine the Batman chart pattern with technical indicators
Another method for trading Batman patterns is to combine them with technical indicators and utilize the two together to generate trade signals.
Technical indicators are tools that use a mathematical formula to draw lines, curves, and other fancy things on your chart.
They are meant to draw attention to certain aspects of the price action that are not immediately obvious when looking at the chart. A moving average, for example, is a type of technical indicator.
Why not look at how moving averages may help in trading the Batman pattern?
On the 5-minute USD/CAD chart below, we used two moving averages: a 50-period and a 21-period simple moving average (SMA).
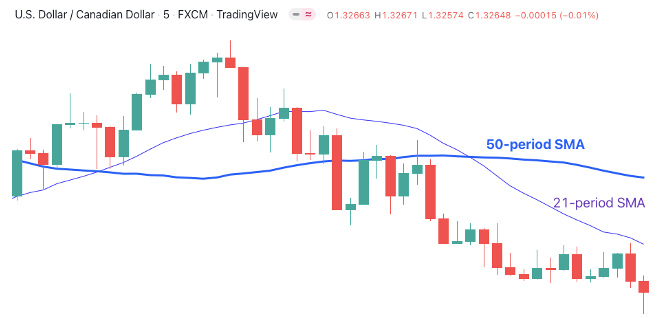
The shorter moving average will react quickly to new prices, whilst the longer-term average will take longer to adjust.
As a result, when the 21-period SMA crosses the 50-period SMA from below, it indicates that the long-term downtrend is changing to an uptrend. Similarly, when it crosses the long-term average from above, the uptrend might be reversing.
Moving average crossover signals can be combined with Batman chart patterns to find good entry points.
Here’s an example:
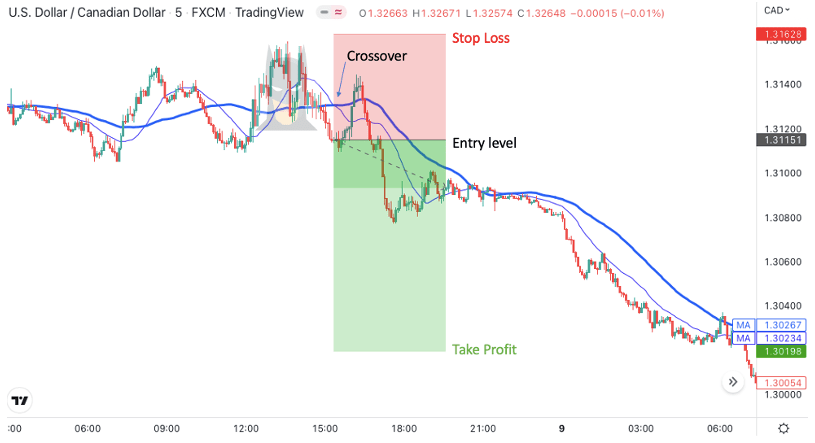
The 21-period SMA crossed the 50-period SMA from above just after a bearish Batman appeared. This was an indication that the market was about to turn bearish.
You could enter immediately after the crossover, with a stop loss above the pattern and a take profit two times the risk.
The Relative Strength Index, or “RSI,” is another excellent indicator that you may use with the Batman.
The RSI measures whether the market is overbought or oversold. Usually, the market is considered overbought when the indicator is above 70 and oversold when below 30.
A good trade opportunity arises when a Batman pattern forms while the RSI is leaving one of its extreme territories.
For instance, the RSI is leaving the oversold zone and a bullish Batman emerges. Here’s an example trade set-up from the GBP/JPY 1-minute chart:
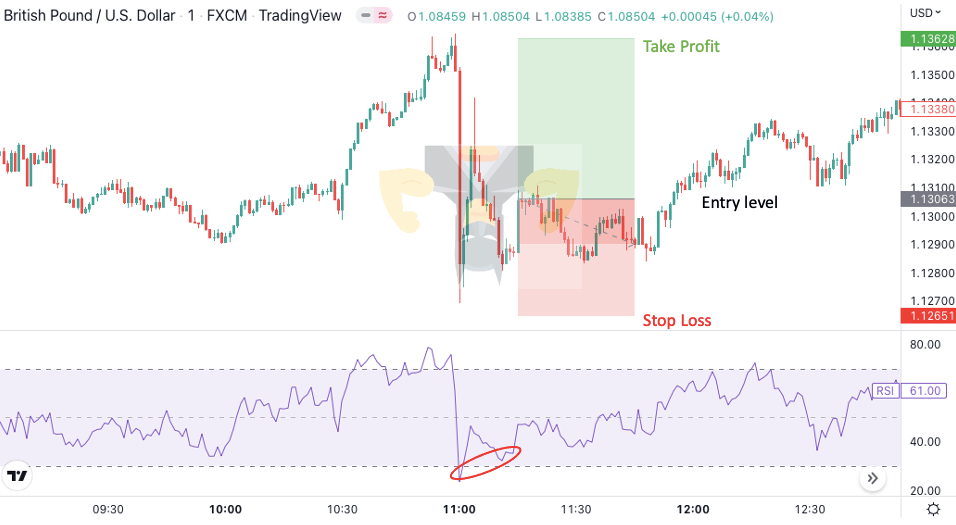
This would have been a winning day trade. It only took about a half-hour for the market to return to the nearest swing high and meet the profit target.
Conclusion
The Batman chart pattern might not be the most well-known, but it can be a powerful tool if you use it effectively.
It’s a nice way to learn the significance of volatility spikes and consider them in your trading.
We hope that the trading techniques mentioned in this guide have helped you recognize some of the pattern’s use cases and how you may incorporate it into your overall strategy.