
Are you using forex indicators in your trading strategy?
These days, indicators are among the most popular components that people put into their trading strategies. Indicators can highlight trading opportunities, increase your objectivity, and make your strategy suitable for automatization.
There’s just one problem.
Without a proper understanding of how forex indicators work, you won’t get those benefits.
So, what is the solution?
Simple. Read this guide.
We have collected the most popular indicators and the latest, best techniques to help your trading business grow.
With this info, you’ll understand exactly what these tools are and how you can use them.
Be warned: There’s a LOT of information here. So, let’s get started!
What Are Forex Indicators?
When traders talk about “forex indicators,” 99% of the time they’re talking about technical indicators in the context of currency trading.
(This is also what this guide is about.)
Basically, technical indicators are computerized calculations used to forecast price changes in financial markets. They can be applied to any chart, including those of currencies.
The calculations are based on past market prices and sometimes volume. Because currency trading is decentralized, meaning there’s no central exchange that would record all transactions, volume data is not accurate.
We’re going to talk about that in more detail when we discuss volume-based indicators. Now, you just need to know that most forex traders use indicators that rely on price.
These are the most popular indicators, anyway, so it doesn’t make a big difference.
What about past prices? Why are they so important?
It all comes down to technical analysis.
Technical analysis says that the market is driven by humans and human nature doesn’t change over time. Consequently, simply by looking at the price, you can spot certain behavior patterns that repeat themselves.

Technical analysis organizes and categorizes these patterns to indicate when there is a greater probability of one thing happening over another.
Looking for well-known patterns such as different chart formations is one of the most common ways forex traders come up with trading opportunities nowadays.
But there’s a catch: A great deal of subjectivity is involved. Therefore, it’s hard to measure the statistical effectiveness of most techniques.
That’s why some people started to develop indicators. These take the raw data and give it back in a way such that there’s no ambiguity.
There are hundreds of indicators out there that, if used correctly, can help identify overbought/oversold markets, trend changes, or optimal risk parameters.
Demystifying Forex Indicators – The Secret to Getting Them to Work for You
Forex indicators are created from price data. It’s not some sort of insider information. It is the same price data that is already available on your chart.
When your indicator is a derivative of price, its ability to predict future prices goes only so far as how the price itself predicts the future.
It makes sense.
The problem is, the price is not very good at predicting the future. No matter what techniques you use, at the end of the day, the future is unknown.
The great thing is that, to be a profitable trader, you don’t have to know the future. You only need a system that identifies situations with a favorable risk/reward ratio (RR) and a tiny statistical advantage.
The key is the RR, because even if you have only a few wins, you can be profitable up to the point where the sum of wins exceeds the sum of losses.
So, you must construct a system that can identify these trade set-ups and that is comprehensive enough to govern your entire trading business.
Here’s what it looks like:
First, there is the “identifying situations” part. Call it a trading strategy. Then there’s the “big-picture” part. Call it the trading plan. These two parts make up your trading system.
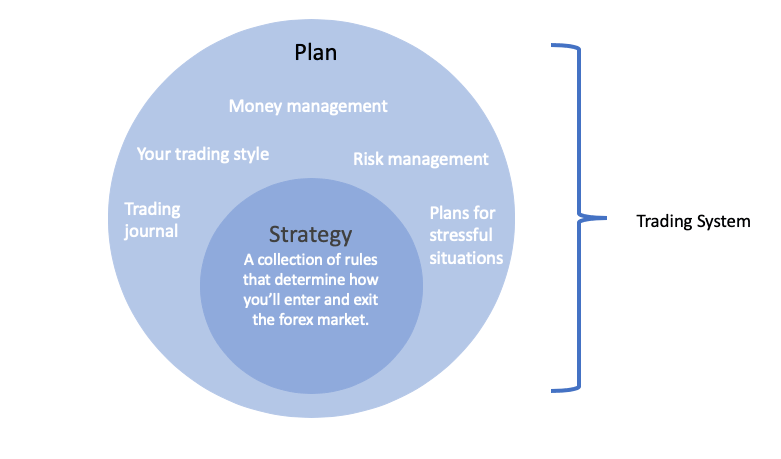
The place where you use indicators is the trading strategy. Once you have built a strategy, make sure you backtest it on historical market data to see if the indicators perform as you expect.
If yes, great, you’re good to go. If no, you can always go back and make improvements. This is how you can benefit from indicators.
In particular, indicators can:
- Help automatize your strategy
- Generate trading signals
- Show overbought and oversold situations
- Indicate trends
- Help measure the strength of trends
Next, let’s look at the two main types of indicators:
Leading vs Lagging Indicators – What’s the Difference?
Leading indicators are indicators that anticipate the upcoming price action. Lagging indicators are indicators that confirm existing trends.
It’s simple, but we must cover a few things so that it makes full sense to you. Before we get into details, here’s a summary of the key differences:

|
Leading Indicators |
Lagging Indicators |
|
|
Purpose |
Predicting Turning Points |
Confirming Trends |
|
Signals |
Frequent |
Rare |
|
Reliability |
Often Misleading |
Typically More Accurate |
|
Reaction to Price Changes |
Fast |
Slow |
Leading Indicators
Leading indicators are created to help you identify possible turning points before they occur.
They are in constant motion between two extreme conditions: typically an overbought state and an oversold state. This is why they’re also called oscillators.
To understand what it means for an indicator to lead the price action, let’s take a look at this picture from BabyPips:
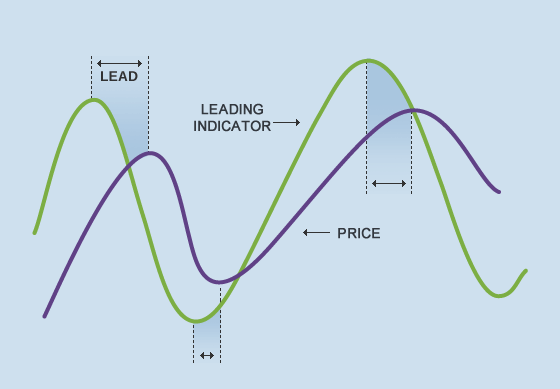
Leading indicators are built in a way such that they turn ahead of the price. This is typically accomplished by placing more emphasis on recent prices and working with smaller lookback periods.
For example, instead of using the past 100 candles, leading indicators might use the past 10. That way, they react more quickly to new price movements.
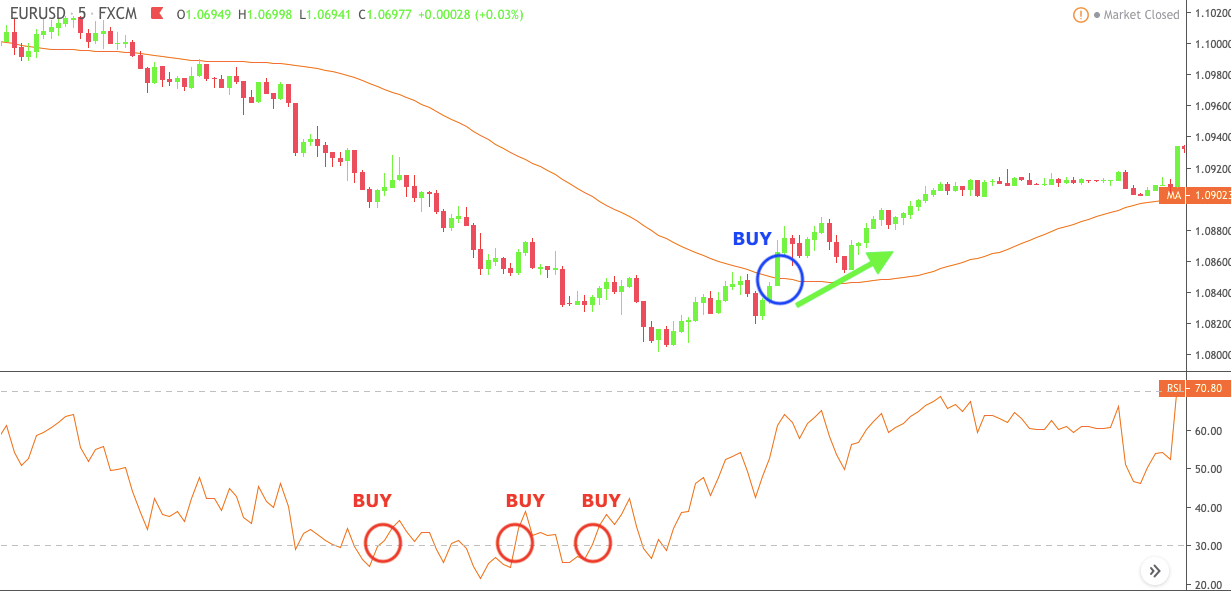
Unfortunately, this method has a serious disadvantage – there are many false signals, as you can see below on the relative strength index (RSI):
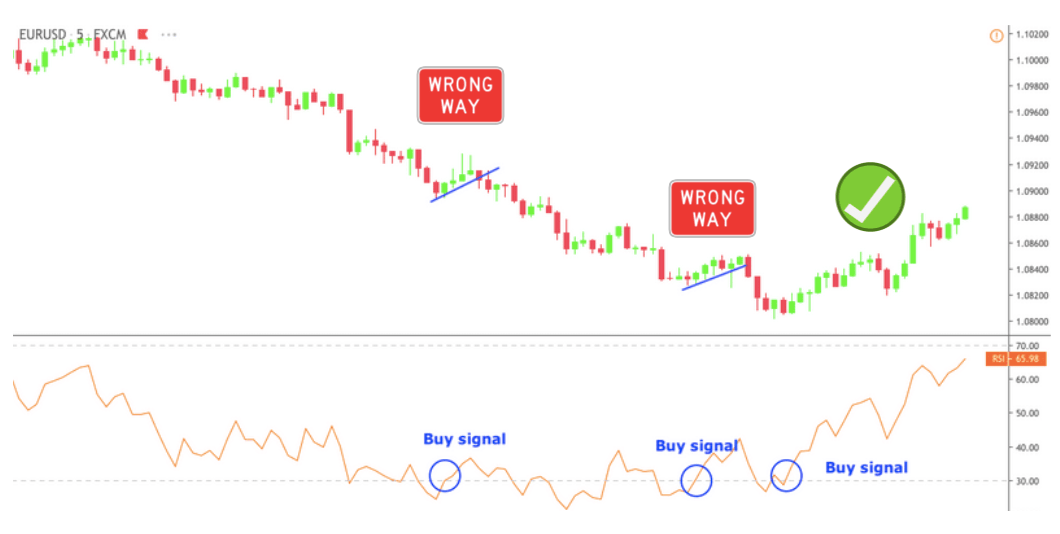
This is unfavorable, but it doesn’t mean you can’t benefit from using leading indicators in your trading strategy.
Note that, in the example above, the signals can be traded with very favorable RRs. That is, the profits are almost always higher than the risks you need to take.
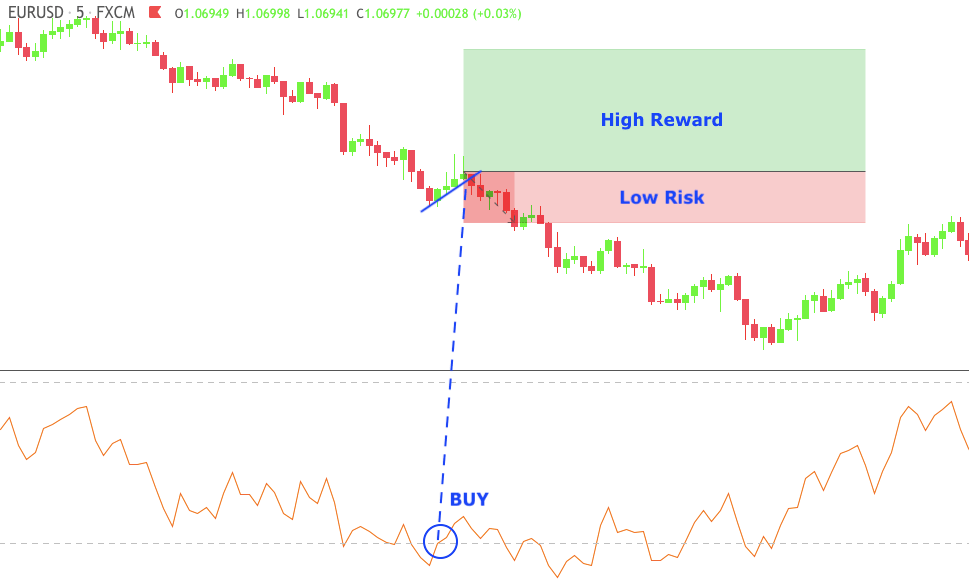
Remember, even if you lose frequently, you can still make money by keeping the losses small and shooting for large wins.
This is just a simple example of how you can use leading indicators. Of course, there are more techniques, as you’ll see later in this guide. For now, let’s take a look at lagging indicators.
Lagging Indicators
Lagging indicators are created to help you confirm trends.
They work with some form of price averaging, which means it takes them longer to reflect changes in the market.
Consequently, they have fewer signals compared to leading indicators. However, these signals tend to be more reliable because the trend change has already happened by the time the lagging indicator catches up.
This can be illustrated with a 50-period simple moving average, which is one of the most basic lagging indicators you can use.
Note how it avoids all the false signals of the RSI and allows you to enter the trend once it is clearly in place.
Unfortunately, lagging indicators also have their disadvantages.
Some of the biggest moves usually take place at the beginning of a new trend, which you will probably miss due to the lagging signal.
Perhaps an even bigger issue is that the transition from one trend to another isn’t always as smooth as the example above suggests.
More often, you’ll see that the market enters a range, and in this situation, lagging indicators completely break down.
The solution to these problems is relatively simple. As Mark from the popular UKspreadbetting YouTube channel says, the best way of using lagging indicators is as a trade filter and not for generating trade signals.
In this guide, we’re going to cover what that looks like at moving averages. However, you can apply the same logic to other lagging indicators.
For now, however, it’s time to dig a bit deeper and further distinguish between different types of indicators according to their functions.
Types of Forex Indicators – Trend, Volatility, Momentum, and Volume.
Anyone who has been trading forex for a while knows that there are many indicators.
Before you can start using them, there is one final piece you must put in place. It’s essential to understand the four types of indicators.
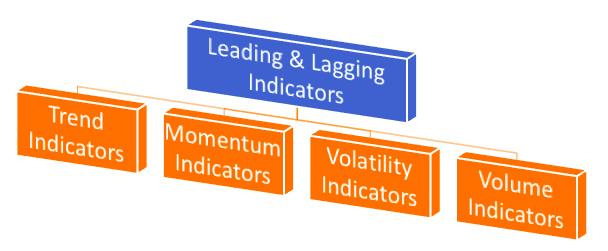
With this information, you’ll know what indicators work best for a particular purpose. Not only that, you’ll also be able to use them more effectively – supplementing one with another and not using indicators with conflicting signals.
With that said, let’s get into it.
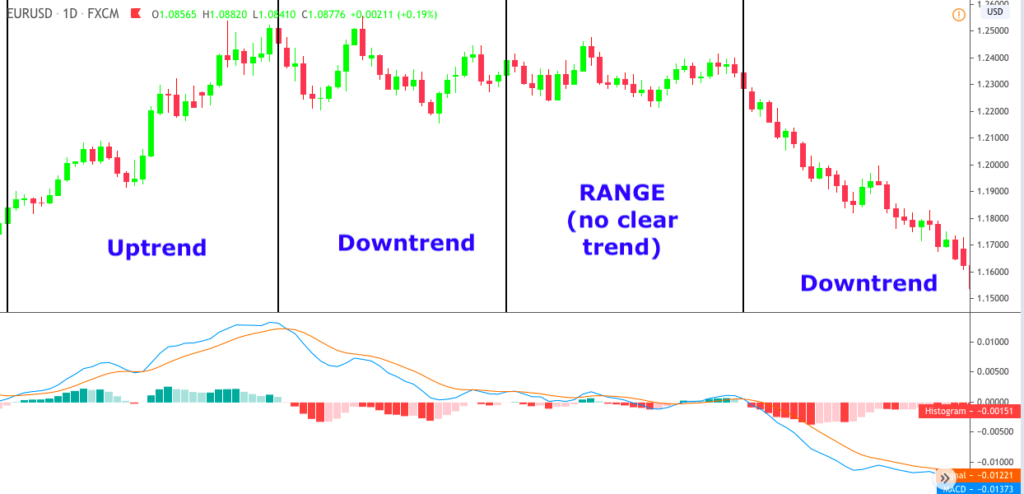
Trend Indicators
Trend indicators show you trends. It sounds deceptively simple, but there’s a lot to it.
Why do they exist in the first place? Wouldn’t it be easier to look at the chart and see if the price goes up or down?
It depends.
If you don’t have a reasonable process for determining trends, there’s a very good chance that you will see what you want to believe.
Now, of course, you can have a reasonable process without indicators. For example, you can make rules such as two higher highs and higher lows for an uptrend.
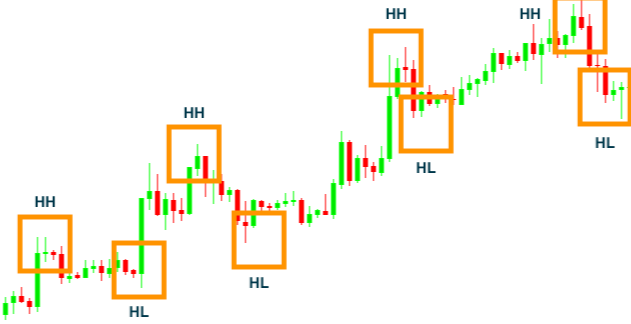
However, you can also say that there’s an uptrend when the price is above its 100-day average or when the MACD shows positive values.
It’s just a matter of preference.
Trend indicators in this sense act as trend filters, though it’s possible to use them for generating trading signals.
Usually, when a trend indicator is used for trading signals, a shorter lookback period is applied to make it more leading than lagging.
As always, the “best” setting is hard to figure out. However, you can get close by doing a lot of backtesting.
Experimenting with different settings makes sense anyway because sometimes you will find that the lookback period must be adjusted for more volatile pairs.
Volatility Indicators
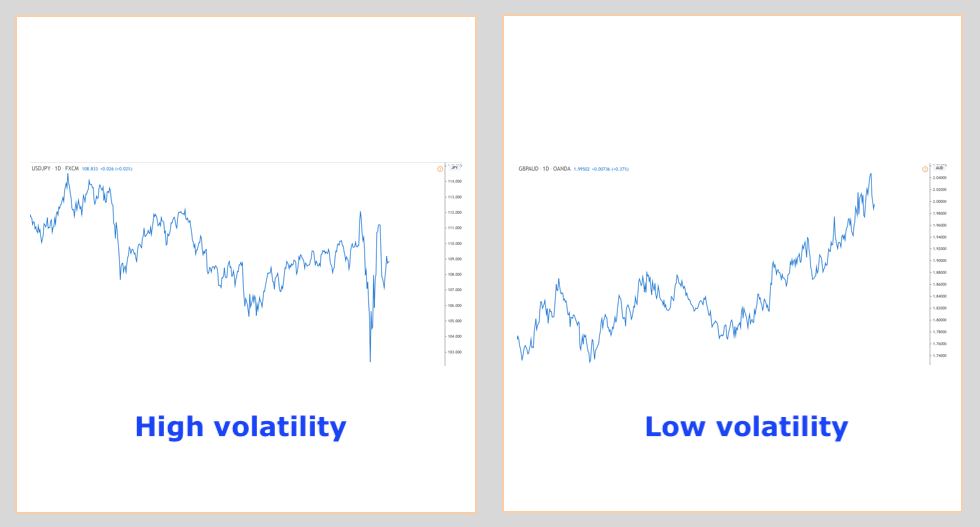
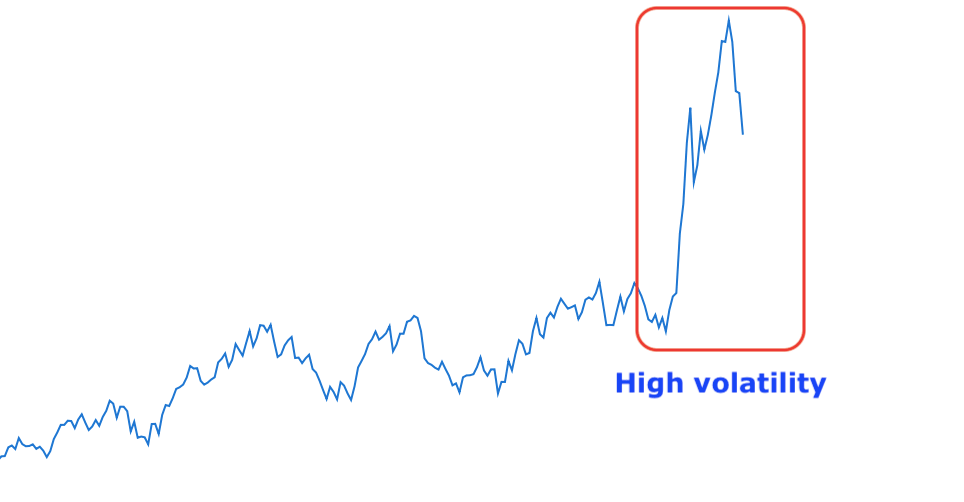
Volatility indicators show you how dramatically the price can change over a short period.
There are different ways to calculate volatility. Usually, it involves monitoring the closing prices to determine how far they spread out around the average price.
High volatility means that there are large swings in the price in either direction. Low volatility means that prices tend to move in smaller increments and behave more predictably.
You can use most volatility indicators to generate trading signals. However, perhaps an even more common use is to determine an optimal distance between the entry price and your stop loss.
When the volatility is high, you might keep wider stops so that there’s less chance of a random price swing taking you out of the market. On the other hand, when the volatility is low, you might keep tighter stops to have a better RR.
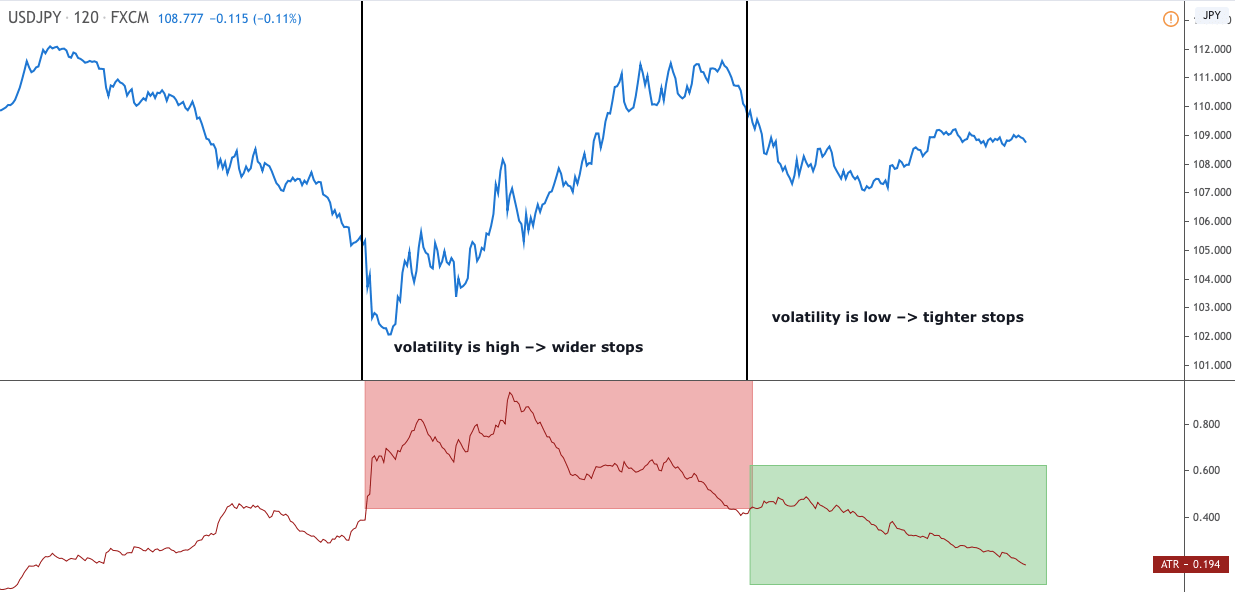
It’s important to note that even currency pairs with generally low volatility can experience periods of extreme and rapid movements. This happens especially after news releases.
Momentum Indicators

Momentum indicators show the perceived strength of trends.
You may recognize that a currency pair has been trending for a while, but how do you know if the trend is strong or is about to reverse?
Unfortunately, nobody knows for sure.
What momentum indicators do is monitor the rate of change in prices. They show whether the trend appears to be healthy or is running out of steam.
Most popular momentum indicators, such as the RSI and the Stochastics Oscillator, have boundaries that indicate when the market may be overbought or oversold.
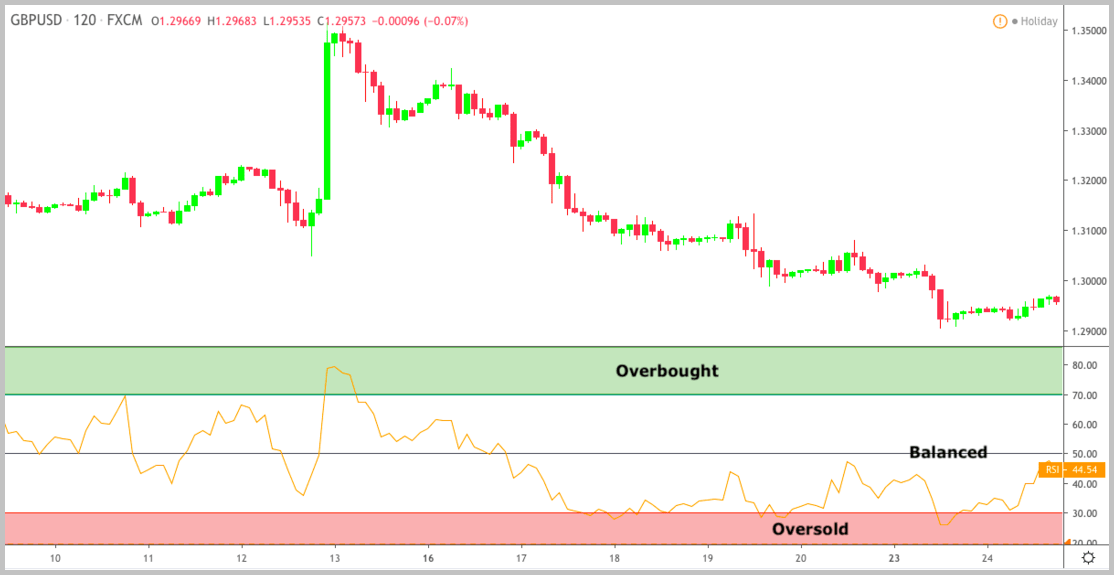
An overbought reading simply means that the price has experienced an intensive upside momentum. Therefore, there is a higher likelihood of a correction shortly. The reverse is true for oversold readings.
Momentum indicators are leading indicators and typically used for coming up with trading opportunities.
Volume Indicators

Volume indicators measure whether or not traders are enthusiastic about a currency pair.
In the stock market, the volume is the number of shares that changed hands during a given period at the exchange. For futures and options, it is the number of contracts traded.
But what about forex?
If you read our Forex Market Guide, you might remember that there isn’t a central exchange that records currency transactions. It happens over the counter.
Therefore, forex volume indicators don’t have volume data on the entire market. What they have is the volume coming through your broker.
(The CLS group is the largest FX settlement service in the world, which means it has very accurate data about the trades of players who move the market.)
Notice the word “patterns” and not “numbers.” We talk about general volume patterns that accompany trends and important price areas. We don’t care about the exact numbers because those will be inaccurate.
Looking at the patterns is enough to get a sense of the strength behind trends and important price levels.
For example, if a trend is strong, it’s likely accompanied by rising volume. That’s because increasing enthusiasm is needed to keep pushing the price in a certain direction.
Most volume-based forex indicators are calculated based on both price and volume. They might be leading or lagging.
Popular Indicators for Forex
It’s time to discuss some of the most popular indicators among forex traders. In addition, we’ll show you some actionable techniques you can use in your trading.
All of the following indicators are part of the MT4 charting package. You’ll find them under the indicators section.
Please note that although the techniques presented here are used by many traders, we haven’t personally tested them all.
Make sure you do your backtesting before you risk real money.
Now that we’ve said that, let’s get started.
Simple Moving Average (SMA)
As its name implies, the SMA is the simple average of a currency pair’s price over a given period of time.
For example, a 10-day moving average is the average of the closing prices during the previous 10 days.
Don’t let simplicity deceive you.
The SMA is a great indicator that can smooth out short-term price fluctuations and highlight longer-term trends.
Let’s see how you can use moving averages in your strategy:
Trend Filter
Here’s how it works:
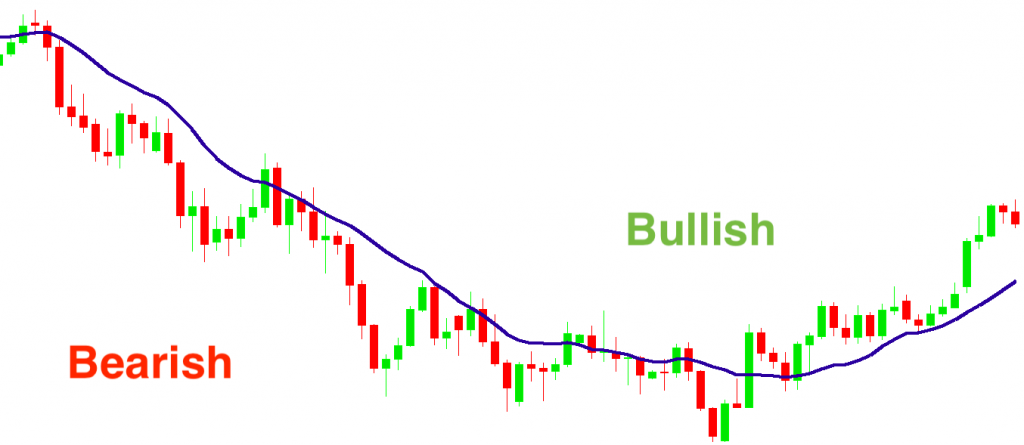
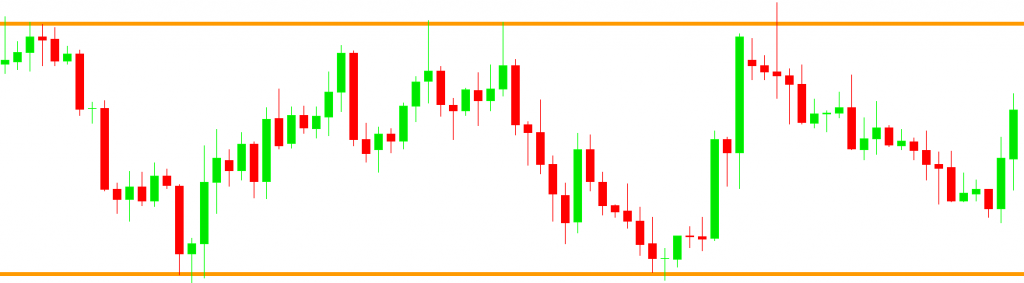
Take a longer-term SMA, such as the 50 or 100 period, and notice if the current price is above or below the average.
Anytime you see the price action take place above the SMA line, only look for buying opportunities.
Conversely, anytime you see the price action take place below the moving average line, look for selling opportunities.
This is an easy but effective technique used by many traders to stay on the right side of the market.
Trade Signal
OK, so you can filter trades with the SMA.
But did you know that moving averages can be also used to generate trading signals?
Well, they can, and that’s exactly what we’re going to talk about here.
The first type of SMA signal is when the price of a currency pair moves from one side of the SMA and closes on the other.
A cross below the moving average suggests the start of a downtrend and a cross above suggests the beginning of an uptrend.
HINT: Short-term averages respond more quickly to price changes while long-term averages are slower but more reliable.
The second type of SMA signal comes from the crossover of two moving averages.
When the short-term average crosses above the long-term average, you get a BUY signal.
On the other hand, when the short-term average crosses below the long-term average, you get a SELL signal.
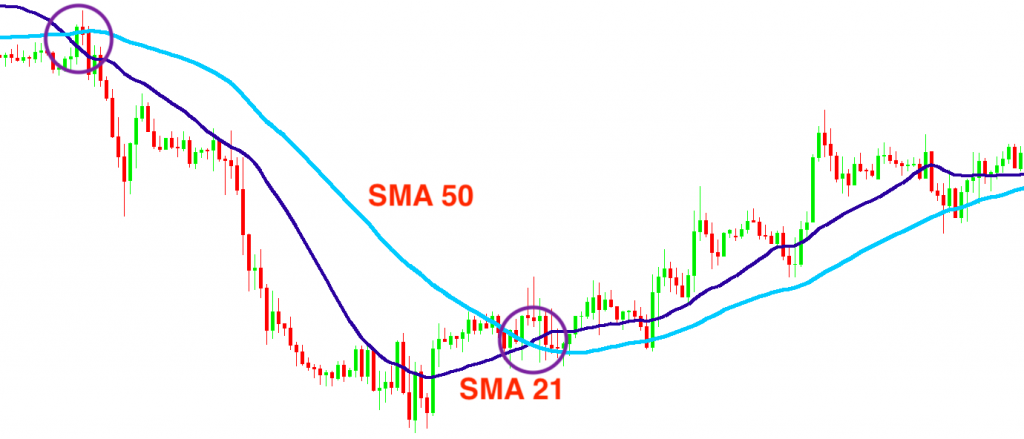
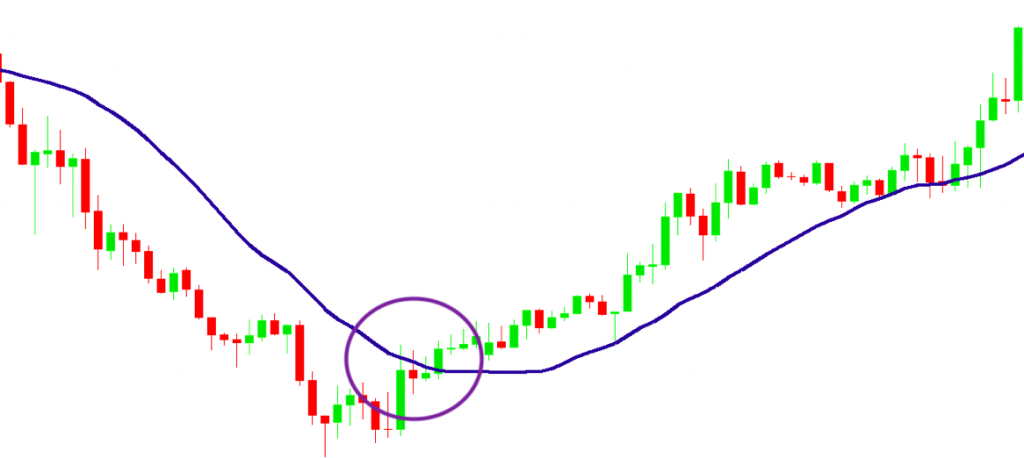
Finally, the third type of SMA signal occurs when the price correction rebounds from the indicator and starts to continue its original trend.
In this case, the SMA acts as a dynamic support or resistance level.
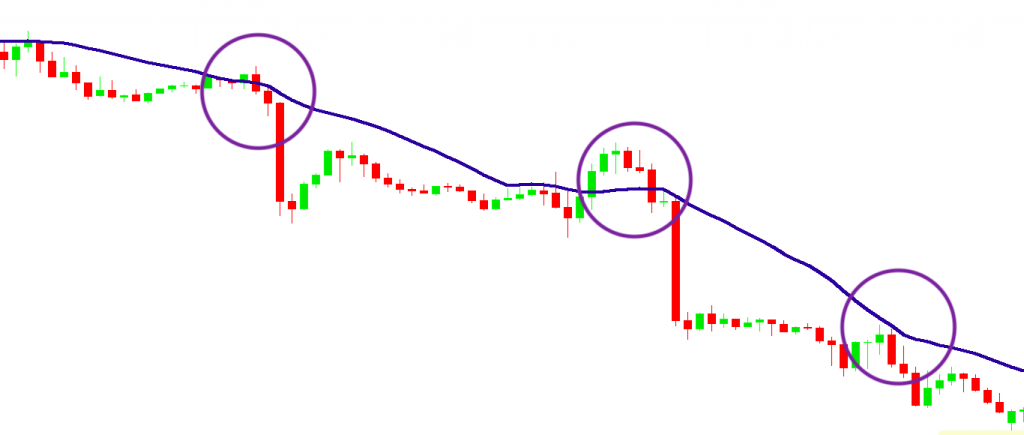
(Don’t expect the price to always turn right at the SMA line.)
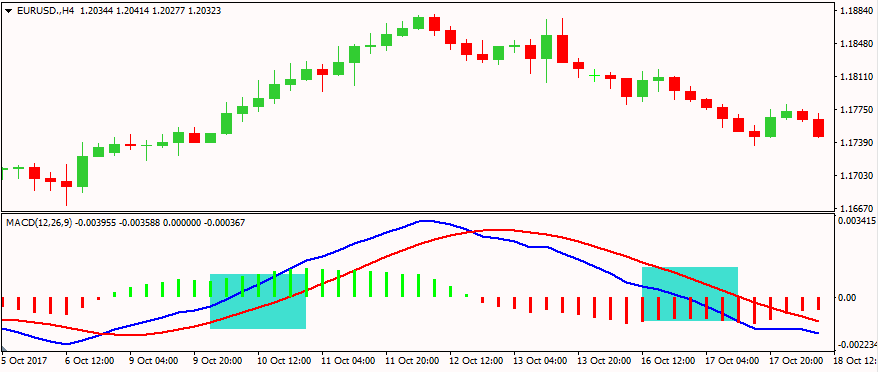
Moving Average Convergence Divergence (MACD)
The MACD is a lagging trend indicator you can use both to identify a trend and to measure the strength of a trend.
The indicator plots two lines and a histogram inside a belted area under your trading chart.
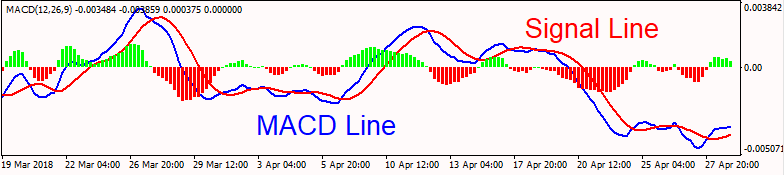
Let’s break it down:
The first line is the so-called MACD line that shows the difference between a 12-period EMA and a 26-period EMA.
(These two EMAs aren’t featured on the indicator.)
Now, you are probably wondering what EMA stand for.
It’s the abbreviation of exponential moving average—another type of moving average similar to the SMA, but it places greater weight on the most recent prices.
Which basically means their responsiveness increases, but also, they give more false signals.
The MACD line fluctuates above and below a zero level as the EMAs converge, cross and diverge.
Awesome.
The second line is called the signal line, and it is simply a 9-period EMA built on the value of the MACD line.
Finally, the histogram is a bar chart that illustrates the difference between the MACD line and the signal line.
Now that you know what the MACD indicator is, let’s see how to interpret its signals.
Signal Line Crossovers
You can notice the signal line is slower than the MACD line.
The result?
When a trend starts to reverse, the faster MACD line will react first and eventually cross the signal line, showing the shift in the market sentiment.
Pretty cool.
When the MACD line crosses above the signal line, that’s a BUY signal.
Conversely, when the MACD line crosses below the signal line, that’s a SELL signal.
In both cases, as the MACD line moves further and further from the signal line, the histogram gets bigger and bigger, which shows the strength of the trend.
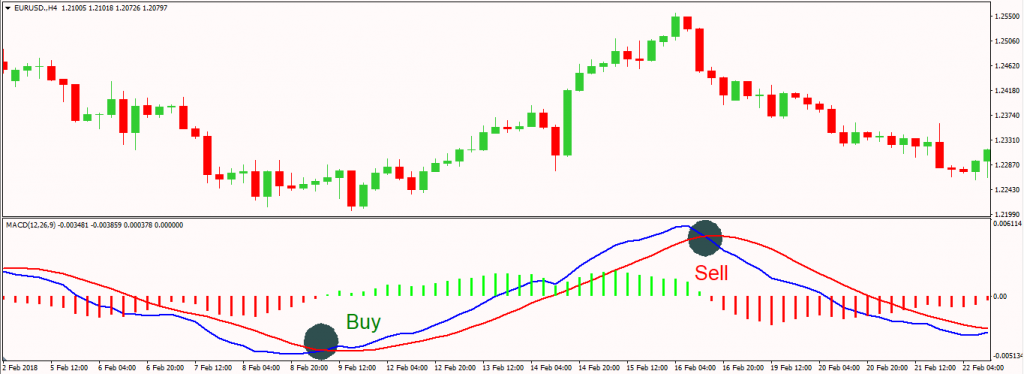
PRO TIP: If you only trade signals in the direction of the long-term trend, you can decrease the possibility of false signals.
Zero Level Crossovers
When the signal line and the MACD line simultaneously cross above the zero level, that’s a sign of a strengthening buying pressure.
On the other hand, when they simultaneously cross below the zero level, that suggests a strengthening selling pressure.
Super-duper easy.
NOTE: The default MACD in the MetaTrader platform is different from the traditional MACD. You can download the indicator we use below.
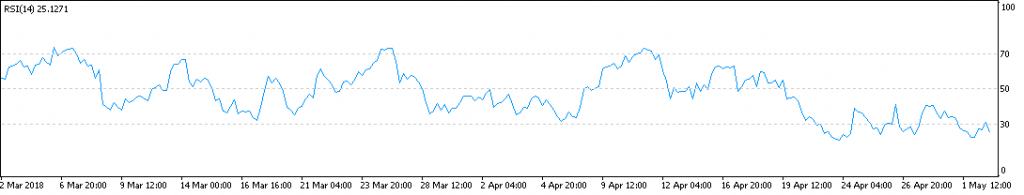
Relative Strength Index (RSI)
The RSI is a leading momentum indicator that measures the current and previous strength or weakness of a currency pair.
It’s presented on a graph below your trading chart and consists of one curve that fluctuates between 0 and 100.
Now, here’s the great thing:
With the RSI indicator, you can easily find overbought and oversold currency pairs.
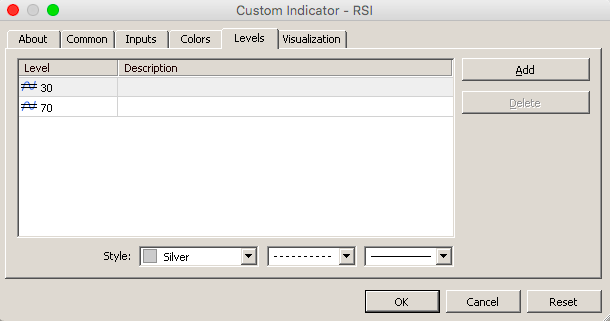
Traditionally, readings above 70 are considered to be in overbought territory and readings below 30 are in oversold territory.
The RSI also marks these two levels automatically with two horizontal lines to make your job even more convenient.
Thanks, RSI. You rock.
PRO TIP: Manually add the 50 level, because it can be very helpful in confirming trends.
Let’s see some killer RSI techniques:
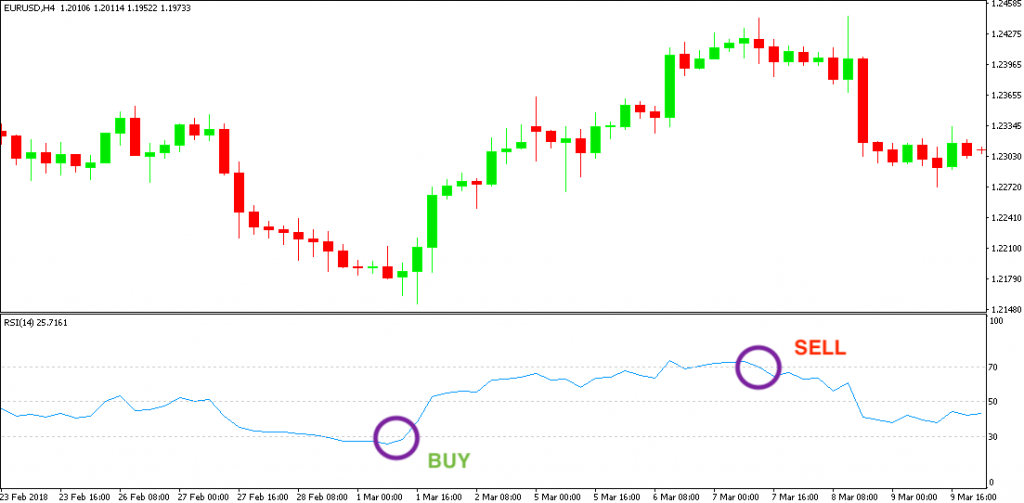
Pick Potential Tops and Bottoms
If the currency pair’s price experienced a relatively huge increase in the recent periods, the RSI will respond with a higher value.
No surprise there.
However, once the price enters into the overbought territory, there will be a point where everybody who wanted to buy has already bought.
And then, guess what?
Sure, the price will drop like a stone.
In other words, you can wait for the price exit from the overbought territory and then hit that SELL button.
In a similar fashion, you can BUY when the price leaves the oversold territory.
RSI Trendlines
Did you know that trendlines can be applied to indicators as well?
Well, they can.
And especially leading indicators, such as the RSI, work pretty effectively with them.
Here’s why:
Like we mentioned earlier, leading indicators are designed to identify turning points before they occur.
As a result, trendlines on your RSI indicator will generally witness breakouts a little bit earlier than traditional chart trendlines.
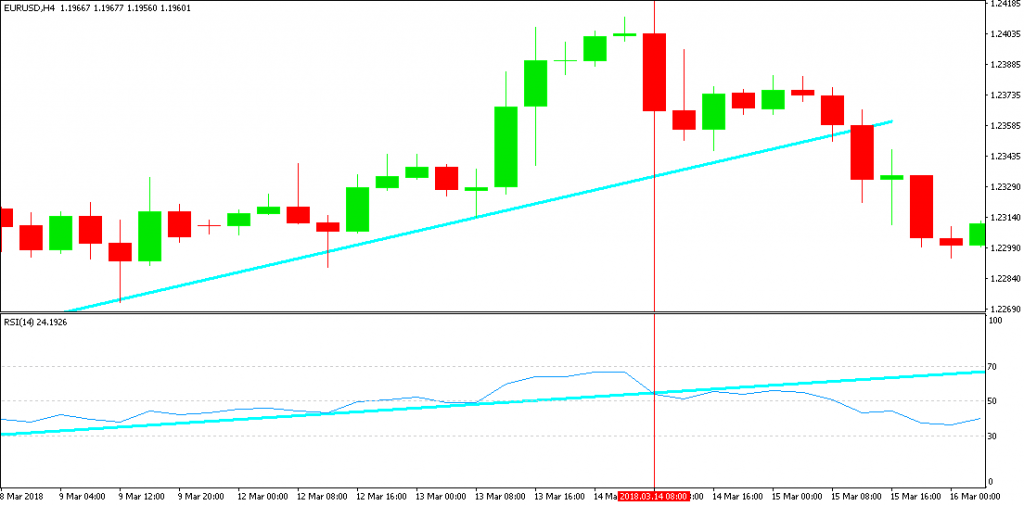
That’s pretty cool.
You can look for trading signals.
Or
You can look for warning signals.
(If you have a position in the direction of the trend.)
That’s all there is to it.
Stochastic Oscillator
Just like the RSI, the stochastic oscillator is a leading momentum indicator that can help you determine where a trend might be ending.
It’s also scaled form 0-100 and has an overbought and an oversold territory, although with different thresholds:
The Stochastic Oscillator is made up of two moving averages.
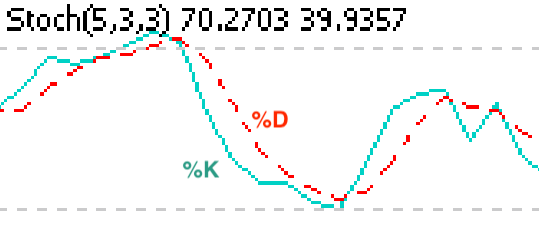
First, the %K line is the main line that measures how a currency pair’s price closed relative to its price range.
Second, the %D line is a moving average of the %K line and acts as a signal line.
The default settings are a 5-period %K and a 3-period SMA for %D.
Here’s the twist:
Because the original stochastic formula was so responsive, nowadays an additional 3-period moving average is also applied to further improve the quality of the indicator.
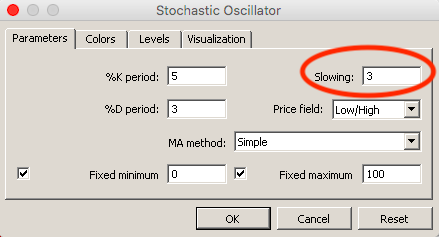
This version is also referred to as the “slow stochastic” while the original formula would be called a “fast stochastic.”
Now, let’s see two popular signals of the stochastic oscillator for Forex trading:
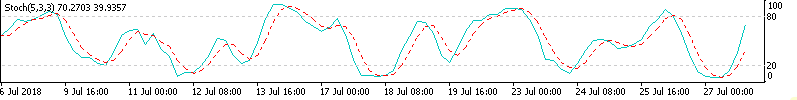
Crossover Signal
This is similar to the MACD signal line crossover technique from a while above.
With an important twist:
The stochastic oscillator crossover signals are more reliable during a range-bound market like this one:
The BUY signal is generated when the %K line crosses above the %D line.
Conversely, when the %K line crosses below the %D line, it generates a SELL signal.
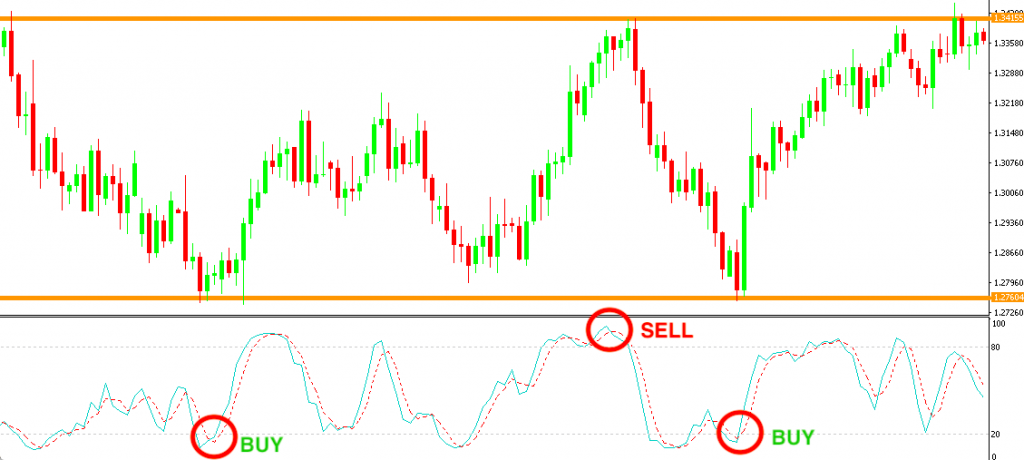
For the best trading opportunities, look for crossovers at extreme levels around the edge of the range.
Trend-Following Signal
Let’s say there’s a strong uptrend.
Everything looks awesome, then you suddenly notice your stochastic has entered into an overbought territory.
Should you close your long position and look for a selling opportunity?
Probably not.
Here’s the thing:
The stochastic oscillator is notorious for becoming too quickly overbought in an uptrend and too quickly oversold during a downtrend.
Now, this can give an illusion that the market is about to reverse.
However, if there’s no further evidence, such as trendlines or emerging reversal patterns, then it’s probably not going to happen.
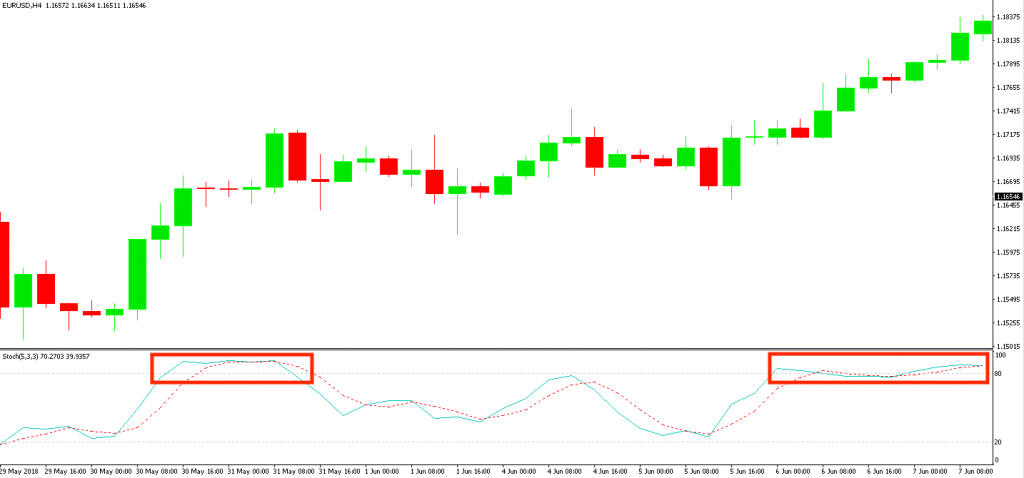
In fact, there’s an event called “stochastic pop” that occurs when prices surge into an extreme condition while the trend seems to be intact.
It’s a signal to increase your position or to close your position if it is against the trend.
Average True Range (ATR)
The ATR is a lagging volatility indicator you can use to determine the level of volatility in the Forex market.
In other words, it’s designed to read how dramatically the exchange rate fluctuates but it does not provide any further information in regards to the trend.
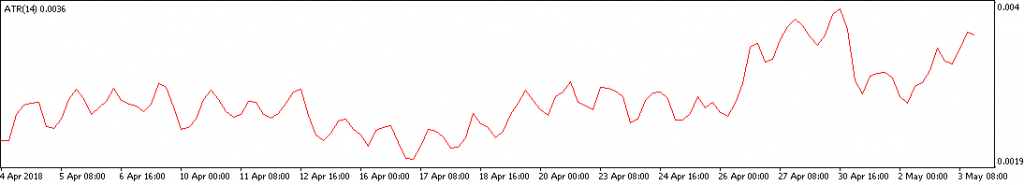
Here’s how to read the ATR indicator:
The current ATR value is shown in the top left-hand corner and expressed in pips.
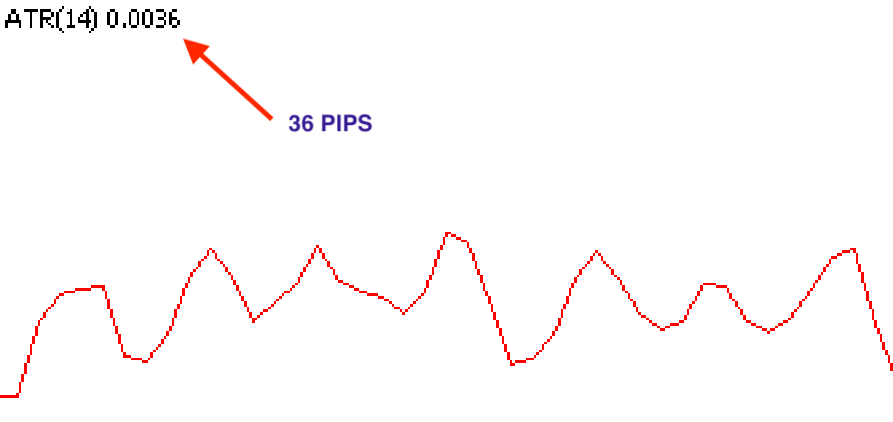
In this case, the price moves 36 pips on average per candle.
The average is calculated for 14 periods by default and automatically updated when a new candle emerges.
For example, on a one-minute chart, a new ATR reading is calculated each minute.
Okay, now let’s see two cool ways you can use the ATR:
Risk Management Tool
You spend hours or even days waiting for the best signal.
You finally open your trade.
Everything points in the right direction.
And then, you get stopped out by a random price swing.
Have you ever experienced this feeling?
If you’ve been trading for a while, then you certainly have.
Fortunately for us, there’s a cool technique you can use to mitigate this problem.
Whenever you open a new trade, take a look at the ATR indicator and place your stop loss at a multiple of its value.
For example, if the ATR shows 10 pips, you can set your SL 20 pips away.
This technique can not only save you money in volatile periods, but it can also help you to establish better risk-reward ratios in quiet markets.
Which means more profits.
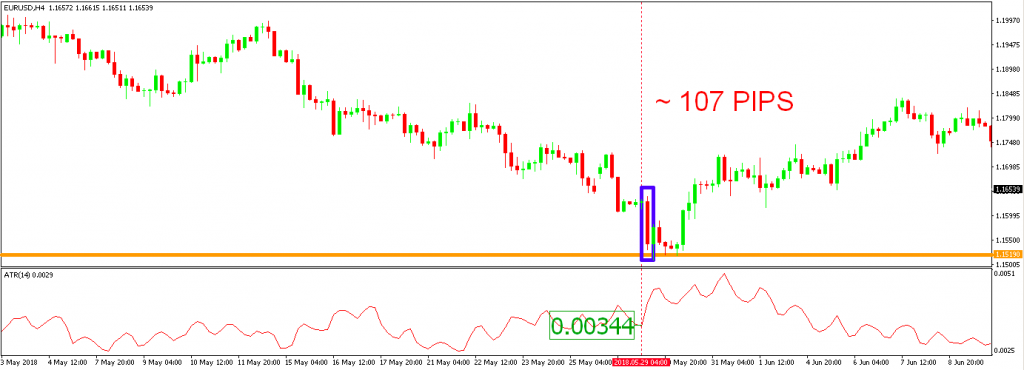
Spot Impending Reversals
Can you work forever without exhaustion?
Of course you can’t.
And as it turns out, Forex trends can’t either.
The result?
A huge advance or decline can often lead to a point where a trend has fulfilled its potential.
The big question is, how do you know where that point is?
We’ll show you:
First, pop the ATR into your trading chart.
Second, double its value.
Third, when you see the market moving at two times the ATR value, chances are the trend is about to reverse.
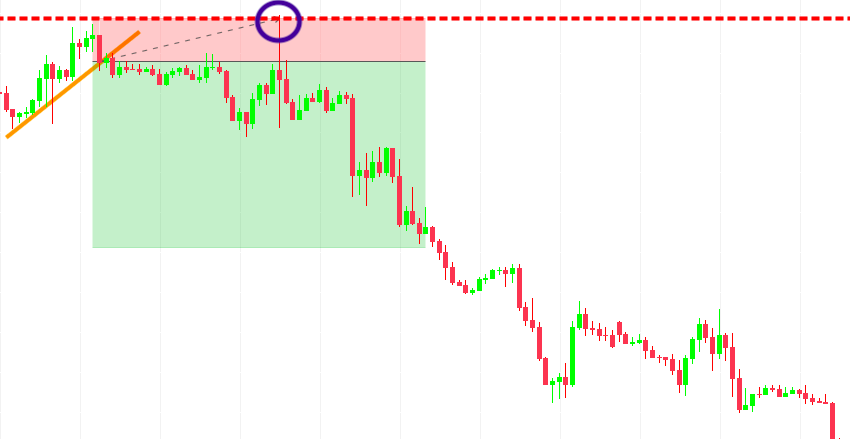
Now, a quick word of warning:
You don’t want to use this technique as the only entry signal.
Instead, combine it with support and resistance zones, and you’ll soon find yourself identifying trend reversals like a pro.
Accumulation/Distribution
The accumulation/distribution indicator is a volume-based leading indicator used to determine whether traders are accumulating (buying) or distributing (selling) the currency pair.
Or put another way:
You can use the A/D indicator to confirm trends or to warn of weak trends that can reverse soon.
Let’s see:
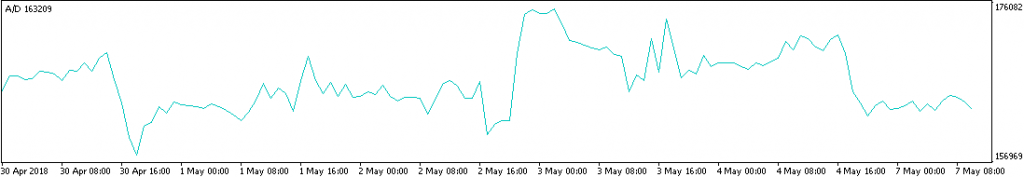
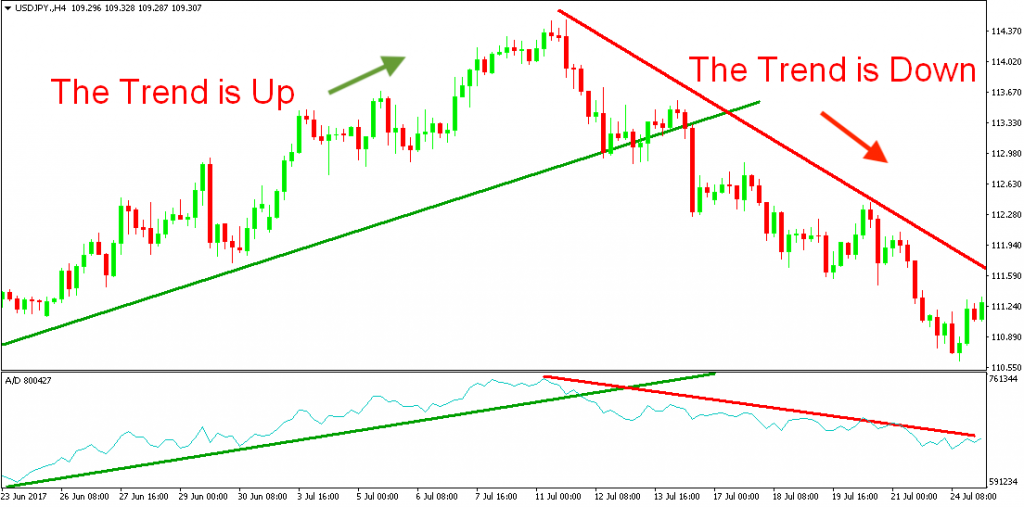
Trend Confirmation
This one is easy.
When the A/D line moves in the same direction as the established trend, it confirms the strength of that trend.
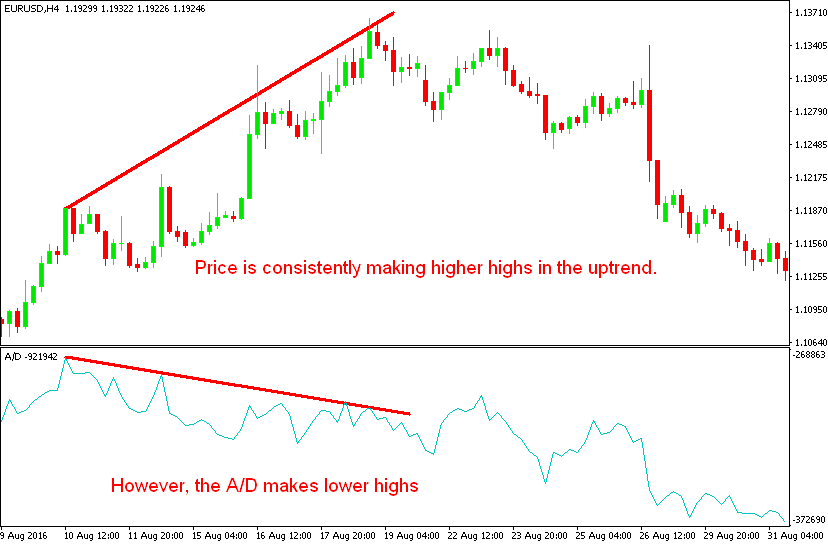
Divergence Trading
Another way of using the A/D indicator is to look for divergences.
What?
Divergence occurs when the indicator and price are heading in opposite directions.
In a nutshell:
When the indicator is trading upwards while the price is trending down, you get a BUY signal.
Conversely, when the indicator is trading downwards while the price is on the rise, you get a SELL signal.
Conclusion
We hope you learned something new from this guide.
Although it might be tempting to stack your chart with different indicators, keep in mind that the simpler your strategy, the better.
A simple method keeps you focused on what the market is actually doing, rather than trying to decode a confusing mess of technical indicators all over your chart.
In addition, you can better manage your emotions and concentrate on your discipline.
Obviously, this doesn’t mean you can’t use multiple indicators in your strategy.
However, you must keep in mind that the key to profitable trading lies in controlling your emotions and trading with a slight edge. It doesn’t need to be complicated.
If you’re just starting out in Forex and don’t even understand the actual price action, then clustering your chart with all sorts of different indicators is not a good idea.
You may first want to develop a feel for the prices.
Check out our guide on candlestick charting and chart patterns.
After you feel comfortable with these techniques, you can start experimenting with different technical indicators.