The RSI indicator is not just a buzzword; it’s a hugely popular technical indicator.
Forex sites refer to it all the time. Even big business channels such as CNBC talk about it frequently.
This means that, if you’re not familiar with this tool, you’re missing out. You feel lost every time someone mentions it. Even worse, you can’t benefit from it.
Here’s the good news: Today, that’s going to change.
This is one of the most comprehensive RSI guides you can find on the internet. But we know that you’re busy and don’t want to wrestle with a mile-long article.
That’s why we’ve created jump links to each section of this guide:
- What Is the RSI Indicator?
- Who Developed the RSI?
- RSI Indicator Formula (Step-by-Step Explanation)
- How to Read the RSI
- How to Trade Using the RSI
- Modifying the Look-Back Period
And, of course, those who are less strapped for time can follow us while we explain all the nitty-gritty details of the RSI indicator.
Let’s dive in.
What Is the RSI Indicator?
Let’s begin by talking about what the RSI indicator actually is.
The term “RSI” stands for “relative strength index.” It’s a technical indicator that you can use to recognizesituations in which a currency pair might be overbought or oversold.
(You can learn more about technical indicators here.)
If we want to be precise (and somewhat geeky), we can also say that it’s a momentum oscillator. But what the heck does that mean?
Momentum indicators show you the perceived strength of a trend. They do this by measuring the velocity of price movements. The math varies from indicator to indicator, but it essentially means monitoring changes in closing prices.
Now, the way technical indicators feature their data also varies.
As with every momentum indicator, the RSI is displayed as an oscillator. This means that it’s plotted within a bounded range and fluctuates between two extreme values. These extremes are 0 and 100.
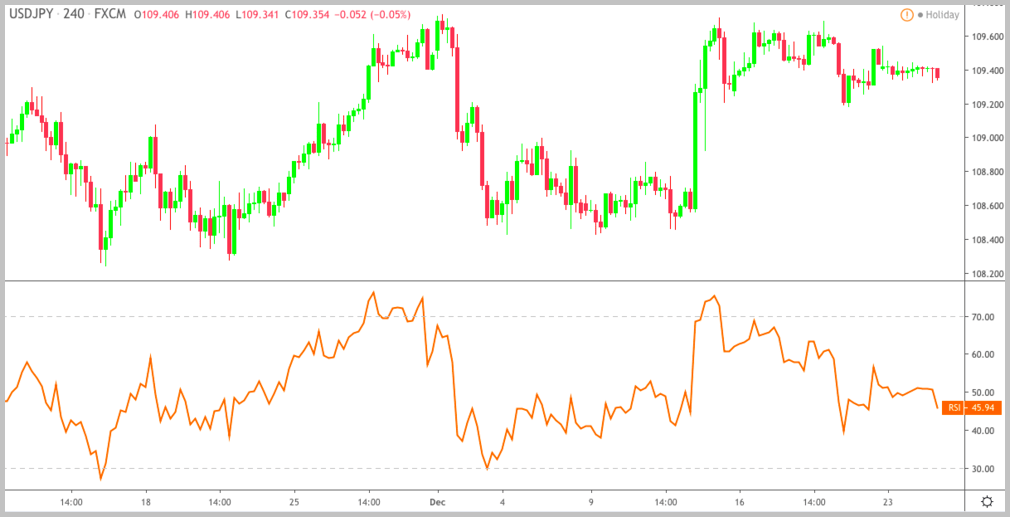
This value is a ratio of the average increase in price to the average decrease in price calculated over a number of time periods (14 by default, meaning that the RSI evaluates the past 14 candles).
Traditionally, the currency pair is considered overbought when the RSI has a value above 70 and oversold when the value is below 30. These levels are automatically marked on the indicator as you can see on the picture above.Who Developed the RSI?
Quick answer: The relative strength index was developed by J. Welles Wilder Jr.

Wilder was born in the United States in the 1930s. He started as a mechanical engineer but quickly turned to investing. Being interested in numbers, he began to experiment with developing trading tools.
In 1978, he released a book titled New Concepts in Technical Trading Systems, which featured the RSI along with other technical indicators.
The book was a massive success and established Mr. Wilder as a leading technical analyst of the time. In the 1980s, he left the US and moved to New Zealand.RSI Indicator Formula (Step-by-Step Explanation)
Let’s be honest: If you’re not into math, you won’t like this part. In fact, you’ve probably already skipped this section after seeing the title.
That’s fine.
You don’t need to know how to calculate the RSI because, nowadays, every trading platform does it for you. But if you’re still interested, keep reading.
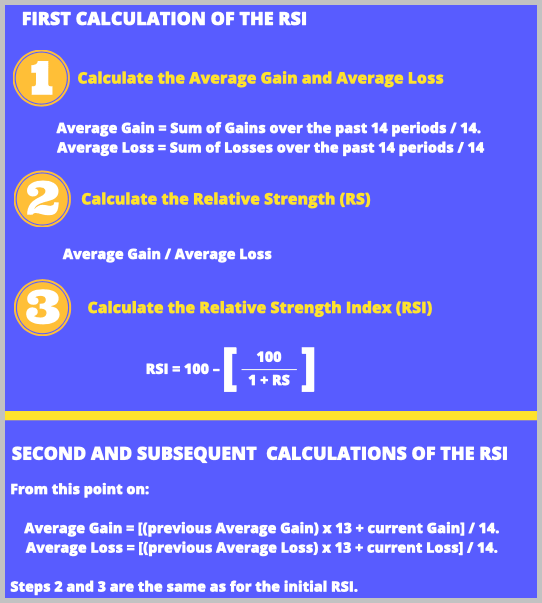
We’ve done our best to break down the equation into simple steps so that you can easily follow along. Take a look at the picture below:
(You may notice that some websites show incomplete or even incorrect formulas. This calculation follows Mr. Wilder’s guidance from New Concepts in Technical Trading Systems.)
Step #1: Calculate the Average Gain and Average Loss for the FIRST Time
Nothing difficult; these are simple 14-period averages:
- Average Gain = Sum of Gains over the past 14 periods / 14
- Average Loss = Sum of Losses over the past 14 periods / 14
Losses are expressed as positive values. For example, if today the EUR/USD close price is 1.2000 and tomorrow it fails to 1.1990, the RSI will take it as a “loss” day with a value of 0.0010 (and not MINUS 0.0010).
Step #2: Calculate the Relative Strength (RS)
The initial relative strength (RS) value is the ratio of the Average Gain to the Average Loss.
RS = Average Gain / Average Loss
Step #3 Calculate the Relative Strength Index (RSI)
The RSI value is calculated by indexing the indicator to 100. Simply follow this procedure:
- Add 1 to the value of the RS.
- Divide 100 by the number you get.
- Subtract this number from 100.
You’re done!
This Is How You Calculate the Second and Succeeding Average Gain / Average Loss Values
Once you have the first value for the Average Gain and Average Loss, their calculation slightly changes:
- Average Gain = [(previous Average Gain) x 13 + current Gain] / 14
- Average Loss = [(previous Average Loss) x 13 + current Loss] / 14
(The previous Average Gain and Loss are multiplied by one less than the fixed period of time.)
This calculation is based on the prior averages and the current gain/loss. In addition, it incorporates a smoothing method, which is necessary to protect the indicator from erratic movements.
Because of the smoothing, RSI values may be slightly different based on the total calculation period.

The calculation of the RS and RSI doesn’t change.
Example (EUR/USD)

How to Read the RSI
The RSI fluctuates between 0 and 100, where 50 indicates a balanced market. Anything below 30 is oversold and anything over 70 is overbought.
When the indicator is above 50, the average gain exceeds the average loss. On the other hand, when the RSI is below 50, the average loss exceeds the average gain.
Okay, great. But what about buy and sell signals?
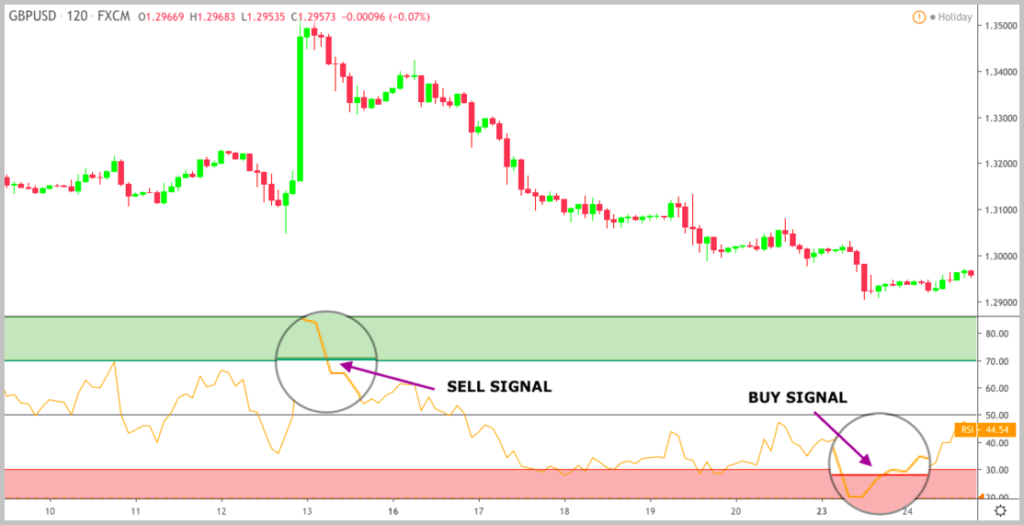
When the RSI enters the overbought territory, traders will wait until the price consolidates and the RSI crosses the level 70 from above. This is seen as a SELL signal because the uptrend appears to run out of strength.
Conversely, when the RSI enters the oversold territory, traders will wait until the RSI crosses the level 30 from below. This indicates a faltering downtrend and is regarded as a BUY signal.
Many traders using the relative strength index also look for what is known as a centerline crossover. This happens when the RSI crosses over the 50 line on the scale.
Centerline crossovers are typically used for confirming trends. For example, you may consider an uptrend valid only if the RSI is above 50.
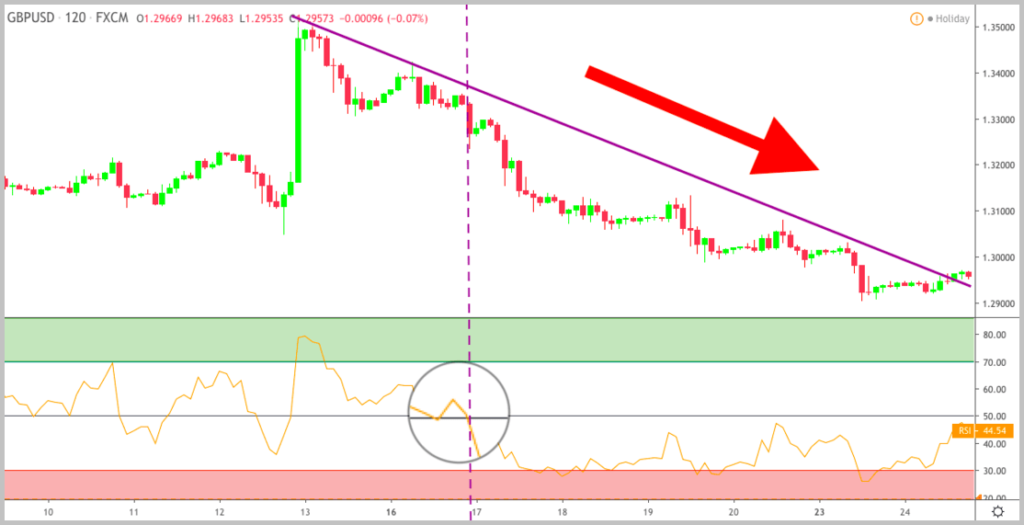
(You might have to manually add the 50 level because it is usually not shown by default.)
Of course, this is just a very simple explanation for those who want to get a quick idea of how to read the RSI. In the following, you’re going to learn more advanced ways to use the index.How to Trade Using the RSI
Let’s talk about using the RSI in practice.
Just as you would expect from our little hint above, there’s much more to the indicator than merely waiting for crossovers.
The key to using the RSI effectively is to put it into a broader perspective. You need to consider the overall price action and other signals when making decisions.
Here are a few ways you can fit the RSI into your trading.
Catch Market Reversals with Failure Swings
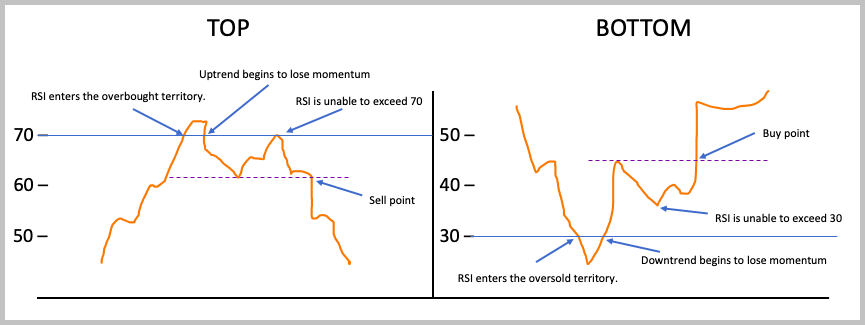
Failure swings can most easily be explained with an illustration:
What happens here?
Take a look at the right-hand side.
First, the RSI enters the overbought territory.
In most cases, this is not a sell signal. If the trend is strong, the RSI can remain overbought for a long time. Some traders would even open a long position at this point.
The second arrow marks the point at which the uptrend begins to lose momentum and the RSI exits the overbought territory. This is a traditional sell signal. We talked about it right at the beginning of this section.
The problem with this technique is the risk that you’re witnessing simply a temporary correction in trend. Naturally, many traders wanted some enhancement to this strategy. That’s how the idea of using failure swings came about.
Although it’s not 100% foolproof, a failure swing adds an extra layer of security when it comes to trading reversals.
Here’s the thing:
With a failure swing, you don’t jump into a short position as the RSI exits the overbought territory. Instead, you’re waiting for the RSI to rise again.
Once it’s rising, you want to see that it’s unable to exceed 70. This confirms that buyers are too weak to maintain the uptrend.
When the indicator breaks below the previous low, you can open a short position, assuming that sellers have taken over control.
Reverse this explanation for the bullish version.
RSI Indicator Divergence
A divergence happens when the indicator is out of sync with the price.
For example, the RSI is increasing and the price action is decreasing or the RSI is decreasing and the price action is increasing.
The idea is that the imbalance between price and indicator is a signal that the current price trend may be weakening. This can increase the likelihood of a reversal.
There are three types of divergences: positive, negative, and hidden. We’ll talk about them in more detail below.
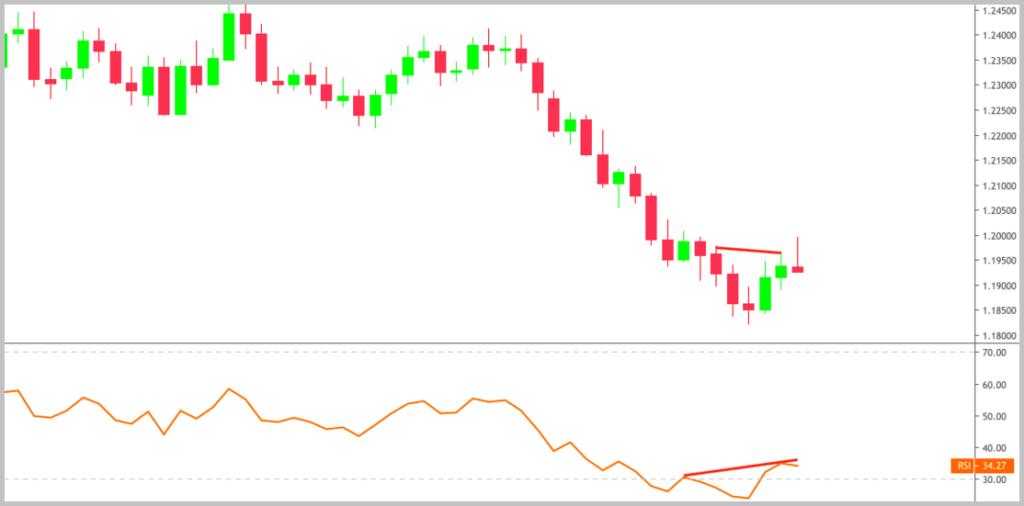
Positive (Bullish) Divergence
Positive or bullish divergence happens when the price is moving lower but the indicator is moving higher. This normally takes place in a downtrend and indicates that the price could start moving higher soon.
The question is: WHY?
And what causes a divergence to appear in the first place?
Remember that the RSI reflects the change in the ratio of the average loss to average gain. In other words, it compares relative changes rather than absolute amounts of change.
This means that as the RSI moves down, it faces increasing mathematical resistance. For example, a move lower when its value is 30 is more difficult than when it was at 50.
We all know that downtrends are characterized by falling prices. Consequently, it’s not surprising that the RSI makes lower lows as the number and size of losses increase.
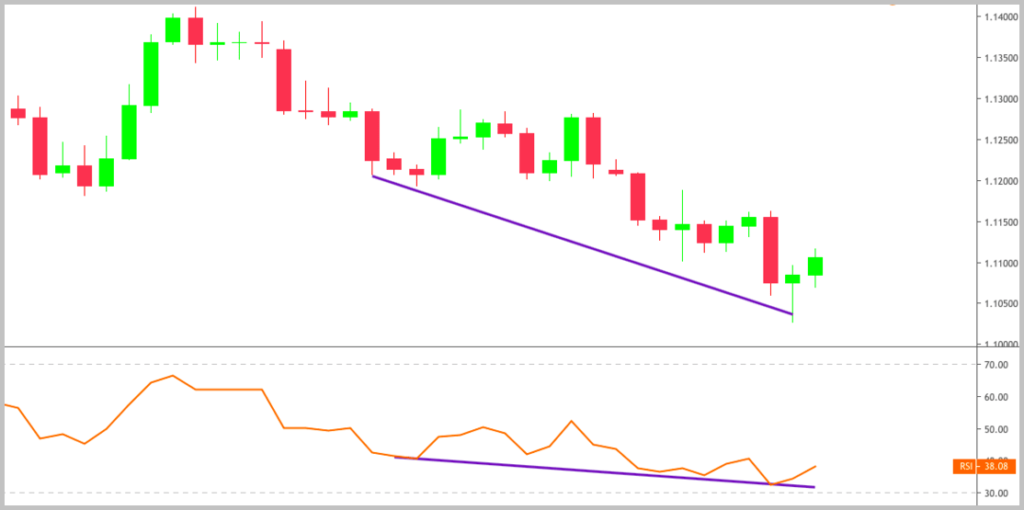
However, at a certain point, prices stop declining and begin to rally as buyers gain strength. This makes the RSI value increase due to its mathematical formula.
In most cases, sellers in a downtrend are strong enough to push prices back lower. As a result, the trend makes a new low and, apparently, nothing happens.
But here’s the thing:
The RSI will be forced lower at a lesser rate than its previous rate of increase. This may result in a situation in which you see a new low on the chart but the RSI shows a higher low.
This is a traditional bullish divergence that indicates a losing momentum in the downtrend. It can be a strong warning signal, especially if the divergence appears near an important support zone.
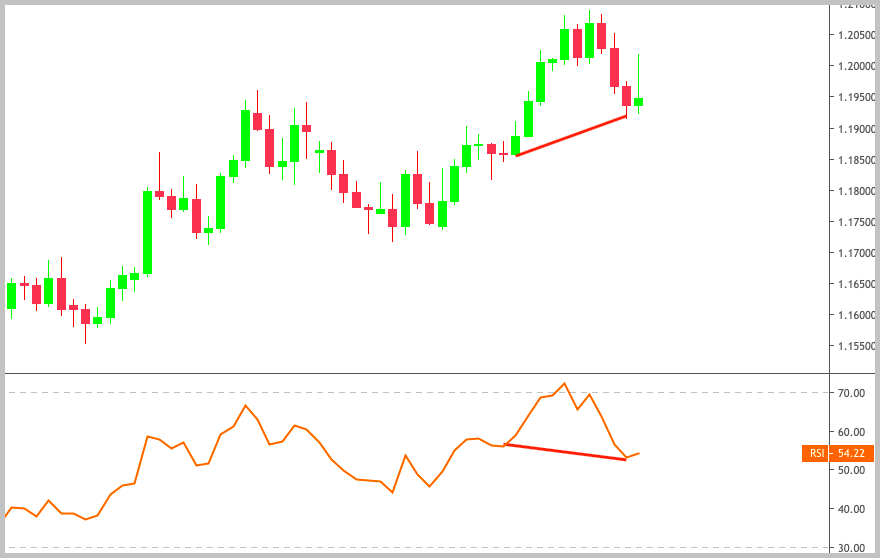
Negative (Bearish) Divergence
Negative or bearish divergence occurs when the price is moving higher but the indicator is moving lower. This normally takes place in an uptrend and indicates that the price could start moving lower soon.
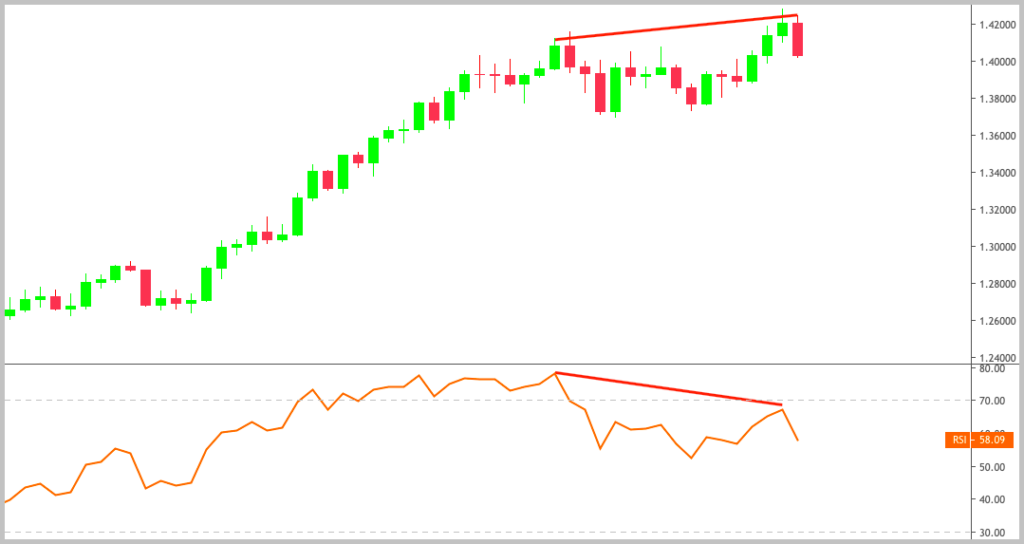
There’s nothing new here; it’s the opposite of a bullish divergence.
When the uptrend is strong, the RSI makes higher highs as the price surges to new highs with each wave. Once the trend weakens, a bearish divergence may appear. This indicates a losing momentum and warns of a possible reversal downward.
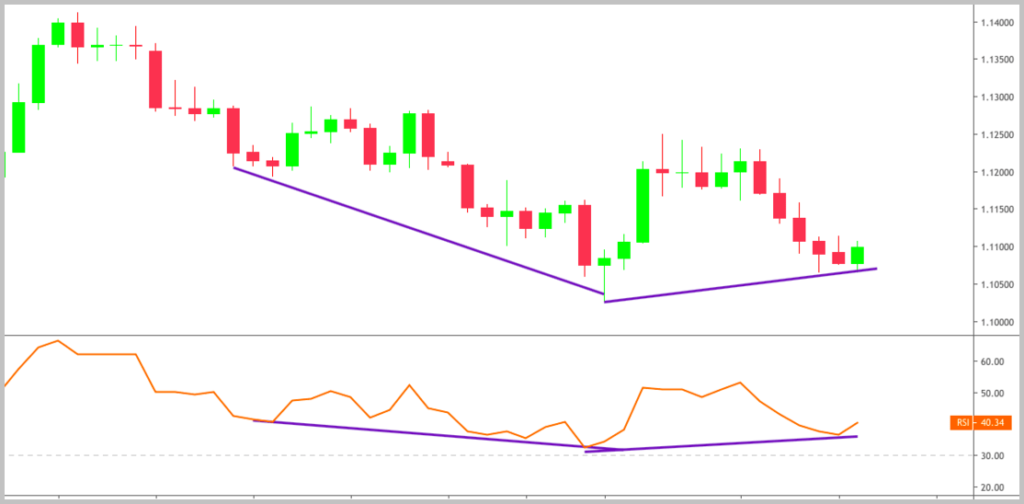
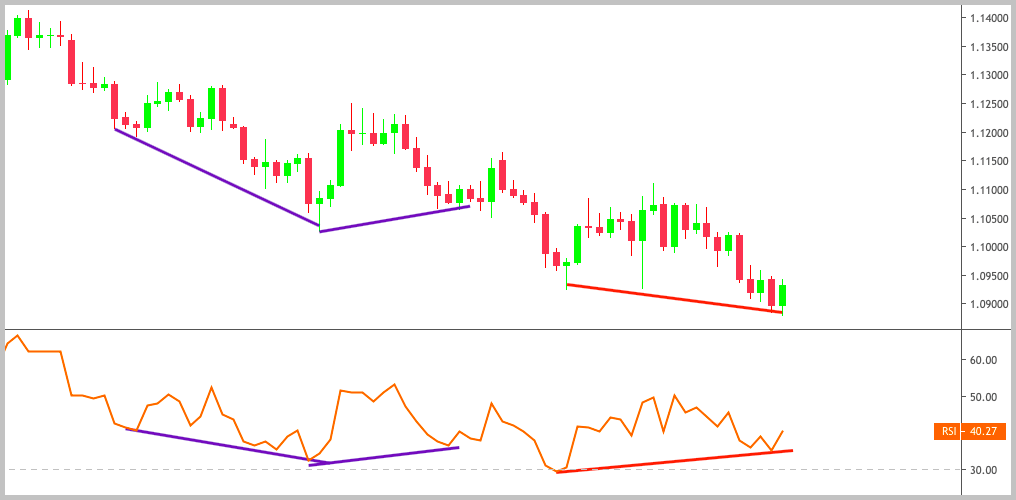
Hidden Divergences
A hidden divergence occurs when the RSI makes a higher high or a lower low while the price action does not. The difference compared to “standard divergences” is that hidden divergences are used as continuation signals.
Hidden bullish divergence happens in an uptrend when the price is reaching a higher low but the RSI is showing a lower low.
Conversely, a hidden bearish divergence takes place in a downtrend when the price makes a lower high but the RSI is making a higher high.
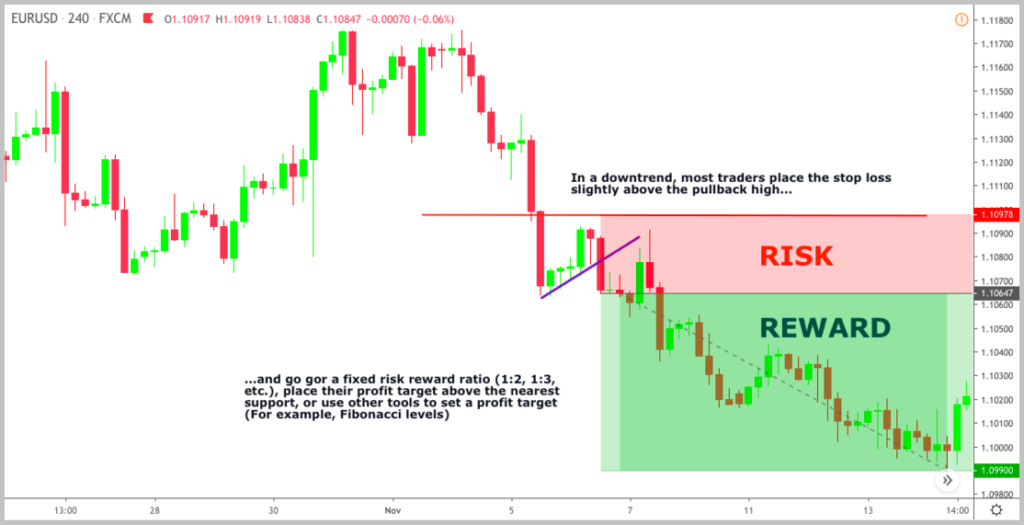
If you take a look at the examples, you can see that hidden divergences occur when there is a brief retracement in the current trend. Traders call this retracement a pullback.
Every trend has plenty of pullbacks because the price moves in waves and not in a straight line. Entering trends on pullbacks is a popular strategy because the risk/reward ratio is typically great.
Although they might seem confusing at first sight, hidden divergences can be regarded as an indicator-based pullback trading technique.
Look for Chart Patterns on the RSI
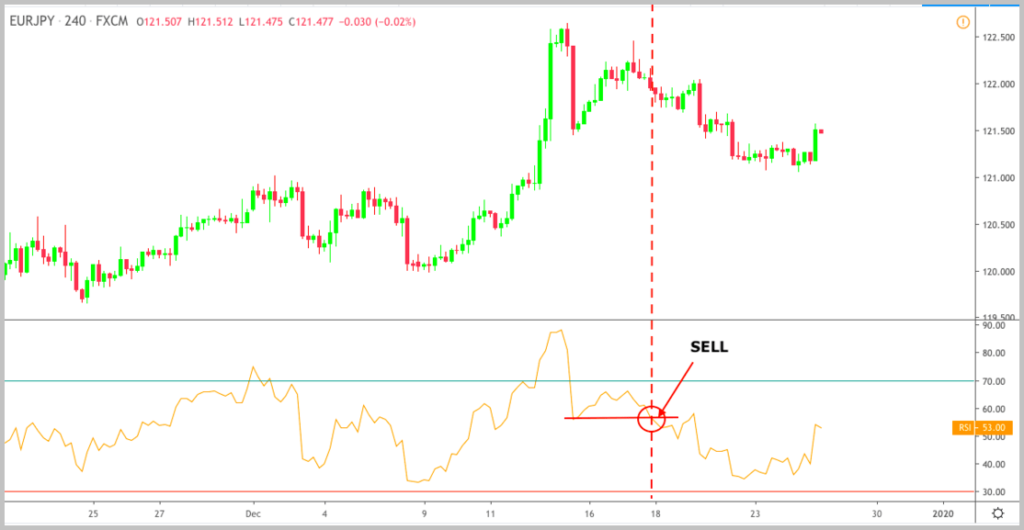
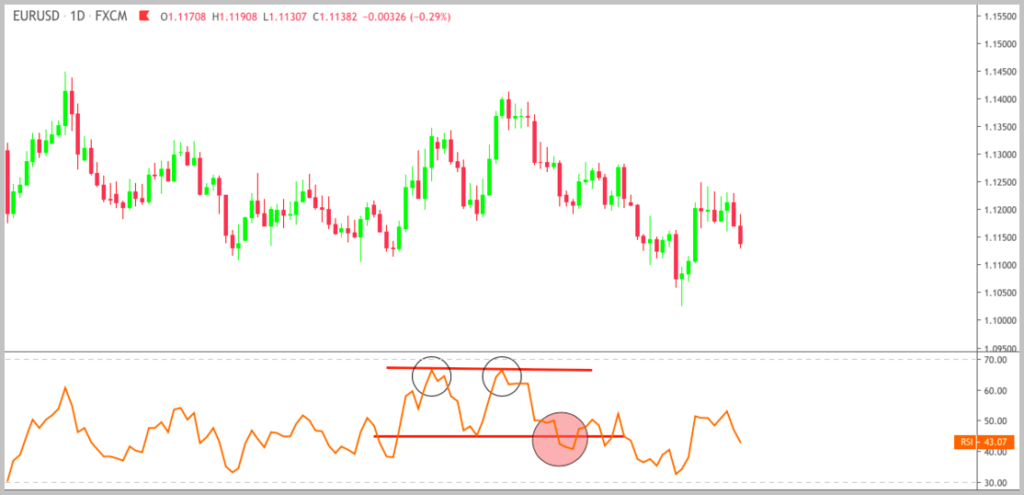
Often, RSI values form classical chart patterns such as triangles, double tops, or head and shoulders that are not visible on the currency chart.
For example, this double top pattern formed on the RSI line is not evident when you look at the corresponding EUR/USD chart.
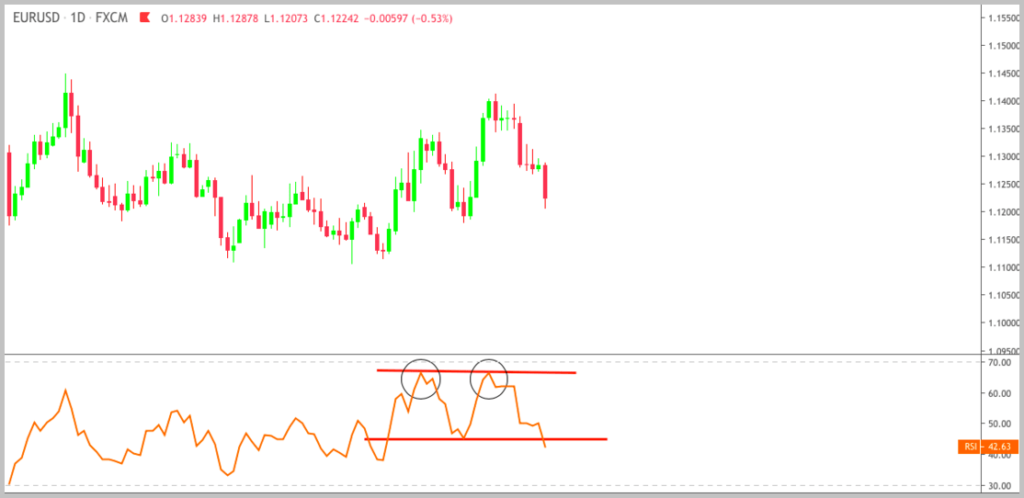
The completion of this pattern indicates an intermediate move in the direction of the breakout.
Remember that a double top pattern is completed when the price—or, in this case, the RSI—falls below the support level connecting the lows of the two prior highs.
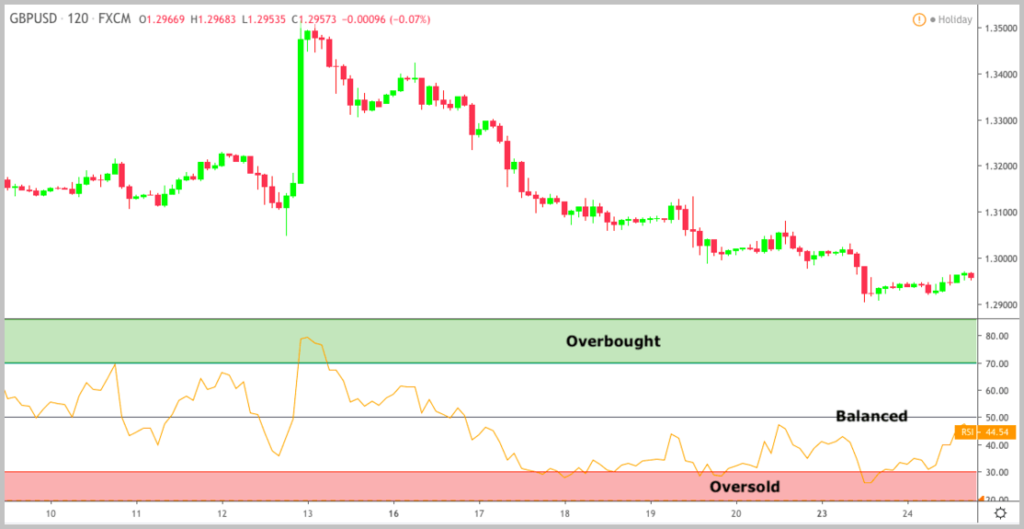
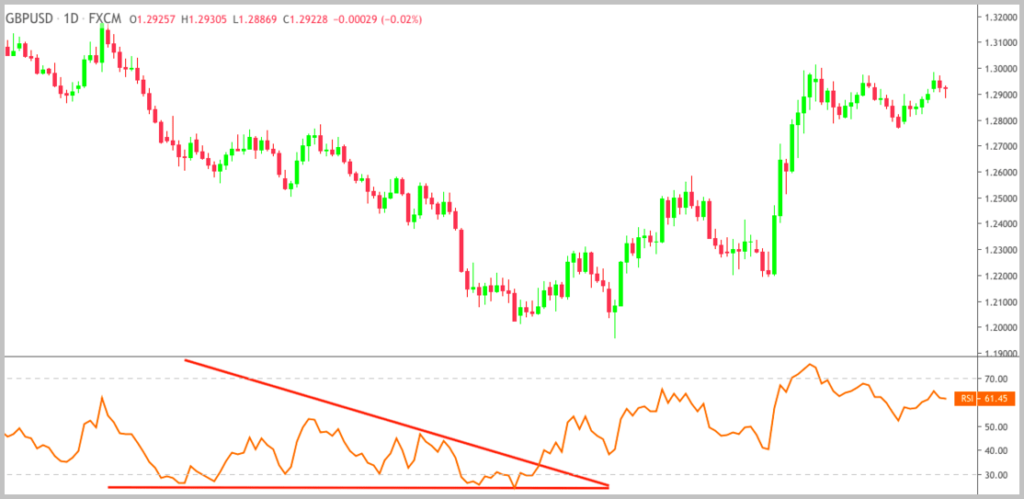
Another example would be this long-term triangle formed under the GBP/USD chart:
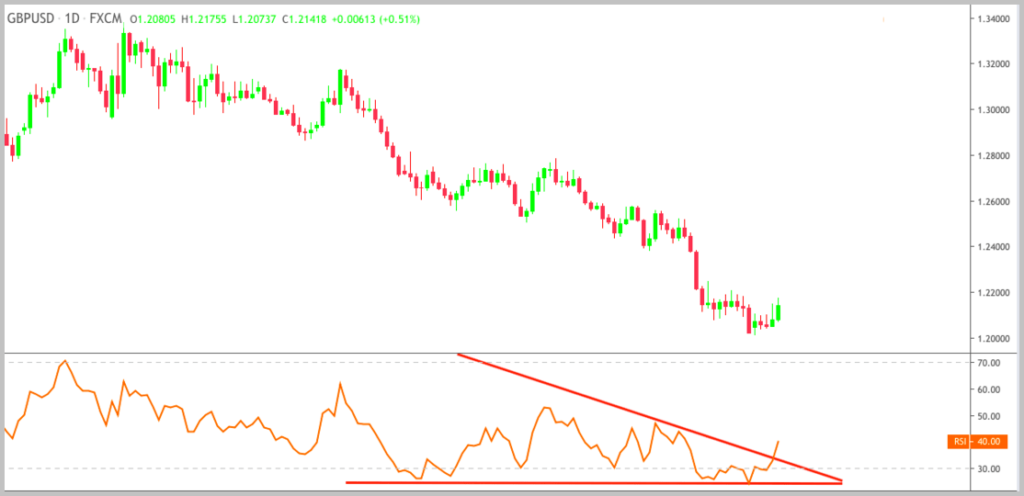
In this situation, the upside breakout marked the starting point of a new trend.
(To learn more about chart patterns and to download our free chart patterns cheat sheet, check out this guide.)
Modifying the Look-Back Period
Because this article is dedicated to talking about all the details of the RSI, let’s also touch on how you can adjust the indicator to be more suitable for your needs.
A common misconception that people have about different indicator settings—not just the RSI but in general—is that there’s a best one.
We see this because we do keyword research for our articles. Often, we find people searching for things like “the best setting for the XY indicator,” “the best period,” and so on.
The fact is, if you think more about it, a one-size-fits-all best period can’t exist.
The reason is quite simple: The market consists of many participants who are using practically infinite variations of techniques and who trade different assets.
The only way to figure out what works well for your situationis through testing. You can search for settings ideas but, at the end of the day, you still have to test them.
Nevertheless, having some perspective on how different settings affect the indicator can be helpful.
What you need to be aware of is that by modifying the look-back period used in the RSI calculation, you make the indicator more or less volatile (i.e., responsive to price changes).
Decreasing the look-back period increases the RSI volatility while increasing the look-back period reduces volatility.
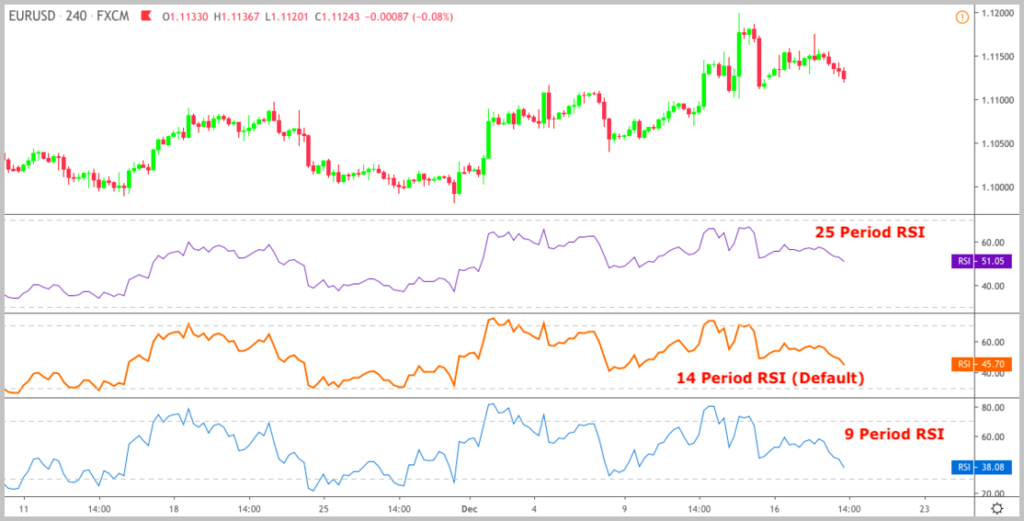
It is pretty much similar to moving averages. The longer the period, the smoother they are and vice versa.
Keep in mind that the RSI’s sensitivity is also influenced by the underlying currency pair. More active pairs such as the GBPUSD will obviously result in wider RSI swings.
(For these currency pairs, some traders change the overbought and oversold levels to 80 and 20, respectively.)
Ideally, you should experiment with a few different periods to see which is optimal for your trading approach.
For example, if you’re an intraday trader, you might use a shorter look-back period to make the indicator more suitable. On the other hand, if you want to ride trends and hold your positions for weeks, a longer look-back period may work better.
Conclusion
We hope this guide helped you understand the RSI indicator.
There are many reasons you should test the techniques we described. However, the bottom line is to see whether they work for you.
Maybe you will find the RSI to be an effective tool to include in your trading strategy. Maybe you will find that you’re better off without it.
That’s okay.
As long as you add to your knowledge base over time, you will eventually put together a profitable trading system or improve your existing one.