Have you heard about the head and shoulders forex pattern but aren’t sure what is it?
The head and shoulders is a formation on your chart that shows the reversal of an up-trending market.
Below we’ll cover head and shoulders basics, including a simple explanation and thorough discussions on various questions you may have.
- What is the Head and Shoulders Forex Pattern? (Quick Answer)
- Head and Shoulders Technical Analysis—What’s the Logic Behind the Pattern?
- Head and Shoulders Pattern Rules
- Head and Shoulders Pattern Entry
- Head and Shoulders Pattern Target
- Failed Head and Shoulders Patterns
- How Profitable are Head and Shoulders Patterns? Should You Trade Them?
- The Inverse Head and Shoulders Pattern
Let’s get started!
What is the Head and Shoulders Forex Pattern?
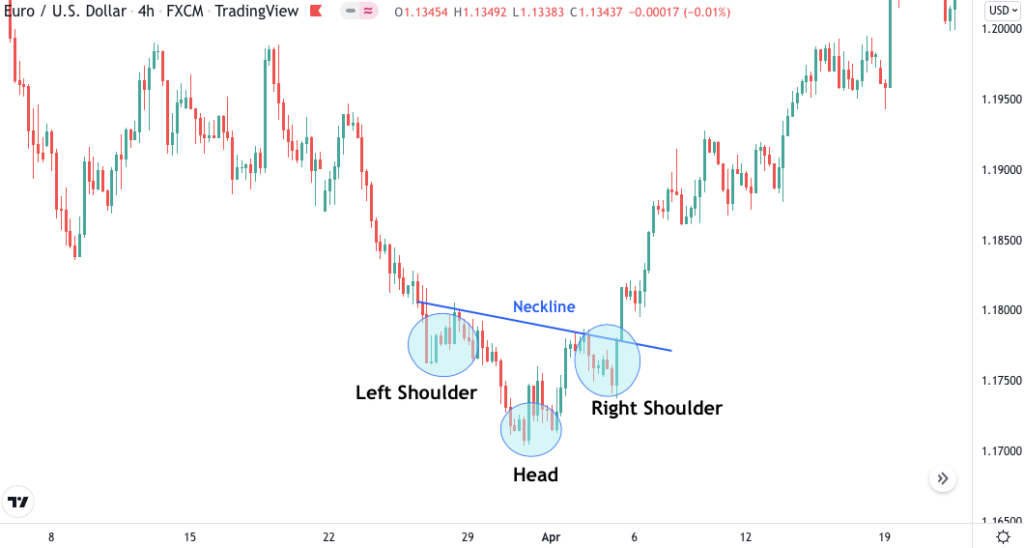
The head and shoulders is a chart pattern that shows when the uptrend is running out of steam. Here’s an example of head and shoulders from the British Pound/Japanese Yen chart:
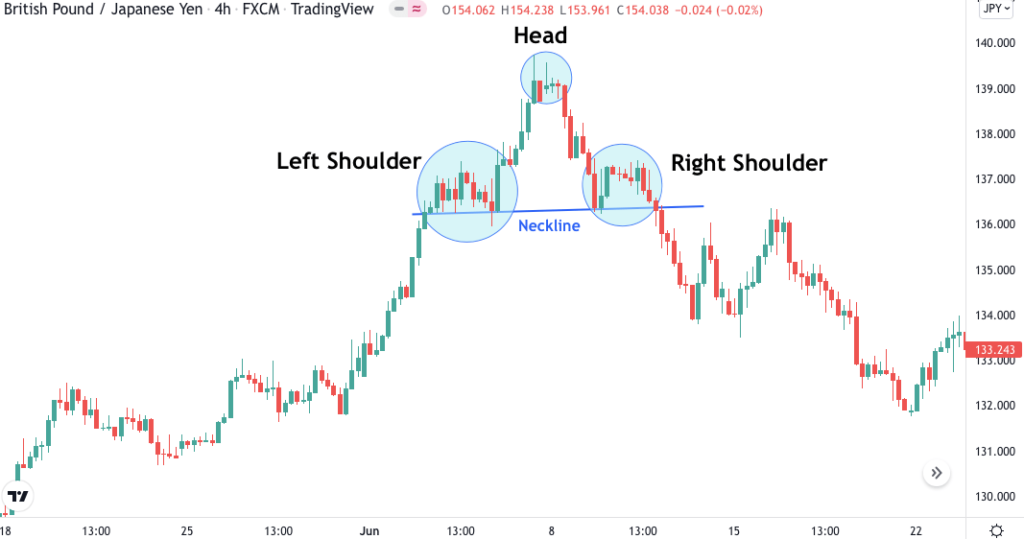
The pattern occurs when the price makes a sequence of three peaks. The second peak is higher than the first and the third, which gives the pattern its distinctive appearance.
The second peak is the head because it is the highest of all three. The first and the third peaks are the shoulders, which are located roughly at the same price level.
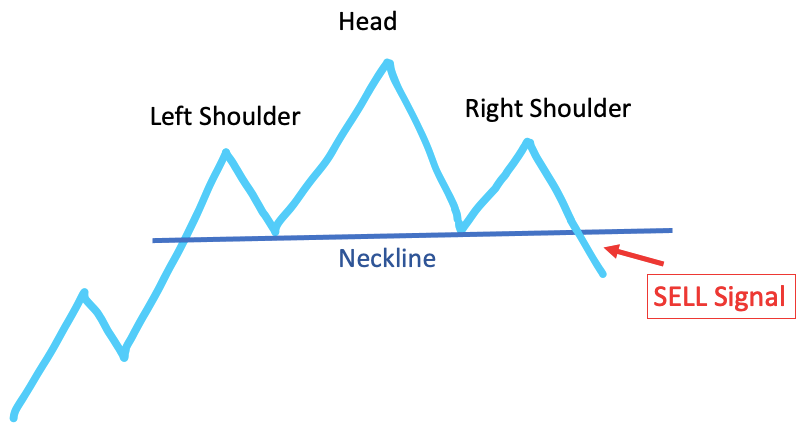
The straight line connecting the bottom of the two shoulders is called the “neckline”. The head and shoulders pattern is completed when the price falls below the neckline after forming the right shoulder.
You have probably already recognized that the head and shoulder is located at the top of the market, indicating that the earlier upward trend is about to end. This makes the head and shoulders a reversal pattern.Obviously not all patterns succeed; there are many failed head and shoulders patterns, which highlights the importance of risk management. Usually, it is a good idea to incorporate more than one technical signal into your strategy to find high probability set-ups.
Head and Shoulders Technical Analysis—What’s the Logic Behind the Pattern?
To help you understand why the head and shoulders pattern indicates that an uptrend is about to end, we’re going to elaborate on the pattern’s features a little more.
Naturally, the formation of the pattern begins with an uptrend. This can be problematic in itself because it requires you to make a decision on what constitutes as a trend.
According to Investopedia, here’s how most traders define an uptrend:
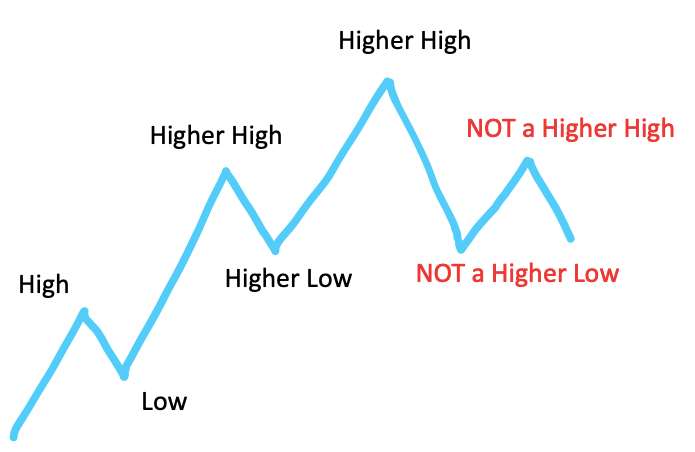
“An uptrend describes the price movement of a financial asset when the overall direction is upward. In an uptrend, each successive peak and trough is higher than the ones found earlier in the trend.”
Visually, it would look something like this:
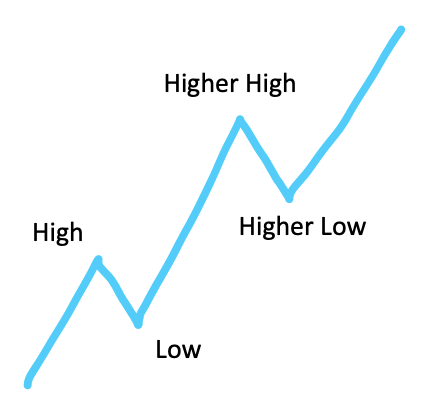
Now if you look at the picture above, the trend looks strong and there are no warning signs. What would need to happen to begin worrying about a possible reversal?
If you said that the pattern of higher highs and higher lows must break somehow, you are right! Notice that the market has already surpassed its previous high, so only one thing can go wrong: The market failing to establish a higher low.
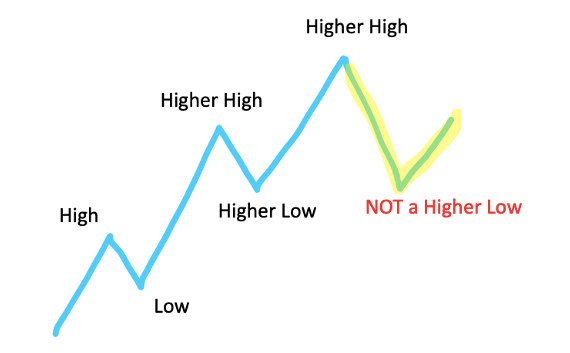
When that happens, you know that something is not okay with the trend. In fact, you can spot an emerging head and shoulders pattern on the chart.
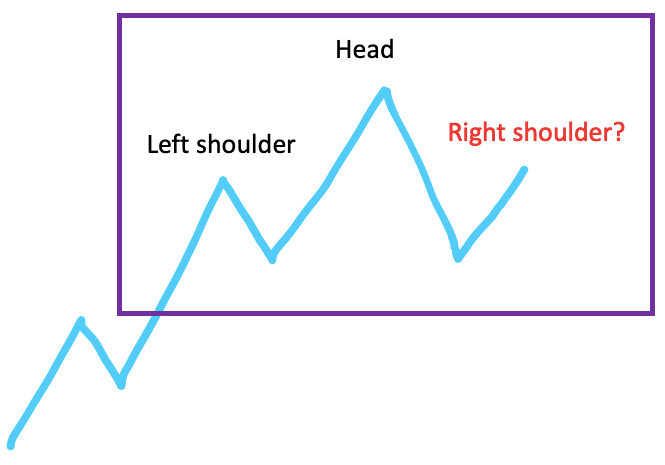
In this scenario you should be moving forward on high alert even though the likelihood of a reversal is uncertain. The trend may be entering a sideways movement and then surpass its previous high (the head) and continue forward.
What reversal traders want to see is the market failing to put in a higher high.
When this happens the head and shoulders are clearly visible and a sell signal is about to occur. Nevertheless, we need one last piece of confirmation: the price must fall below the neckline, which is the price line that connects the troughs.
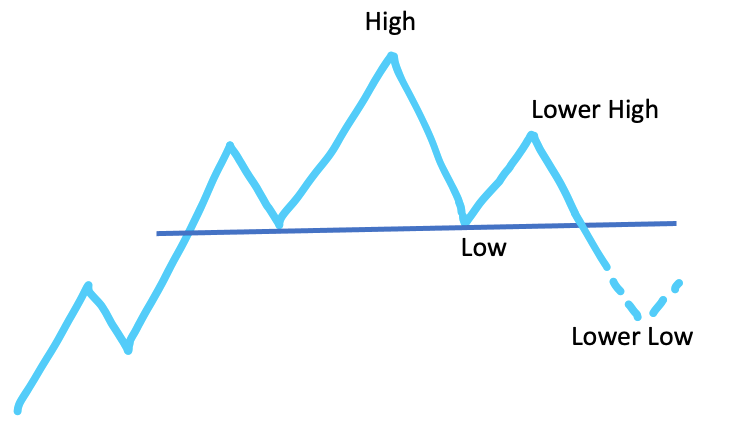
The reason we must wait for the price to fall below the neckline is because despite the head and shoulders forex pattern having emerged, the market can continue moving sideways instead of reversing.
Of course, waiting for a neckline break doesn’t eliminate this possibility entirely but when it happens, a new trend is confirmed as the market will inevitably put in a lower low.
You can’t know how long the new trend will last, but as John Murphy puts it in his book, Technical Analysis of the Futures Markets (page 3): “The whole purpose of charting…is to identify trends in the early stages of their development for the purpose of trading in the direction of those trends.”
That’s where the head and shoulders pattern comes in handy.Remember that as a trader, you consistently look for ways to tilt the odds in your favor. Aligning your moves with shifting market conditions is a good starting point.
It’s important to note that head and shoulders patterns can also occur in downtrend. In an inverse head and shoulders pattern the formation is inverted and all the above principles apply in the reverse direction. We’ll talk more about this later.
Head and Shoulders Pattern Rules
Beginner traders often doubt if they have identified a correct head and shoulder pattern.
If that sounds familiar, don’t worry! We put together a simple checklist that you can use to easily identify the best head and shoulders patterns.
- The pattern occurs following an uptrend, which is characterized by higher highs and higher lows. This will ensure the pattern has the potential to signal a trend reversal.
- The head must exceed the height of the left and right shoulders. Otherwise, it’s not a head and shoulders pattern.
- The neckline should be either horizontal or moderately sloped.
- The overall pattern must be horizontally symmetrical. This means that the time between the right shoulder and the head must roughly correspond to the time between the left shoulder and the head.
- The price must break below the neckline in a relatively short time period after forming the left shoulder. The time required for this should be no longer than the time between the formation of the two shoulders.
Now that you have the head and shoulders pattern rules you can always reference them to validate a pattern you are unsure of!
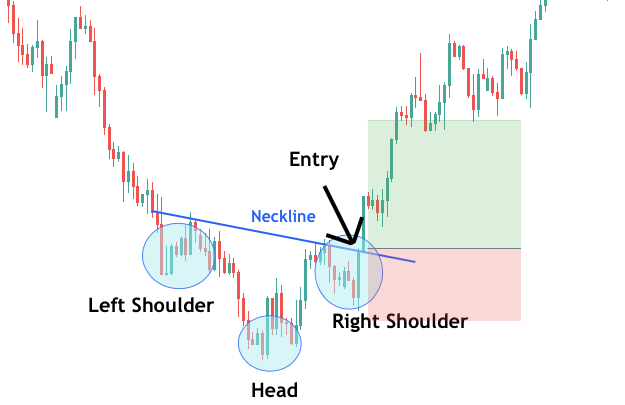
Head and Shoulders Pattern Entry
Entering the head and shoulders pattern trade is rather straightforward. Following the general guidelines, you can enter a position once the price breaks below the neckline.
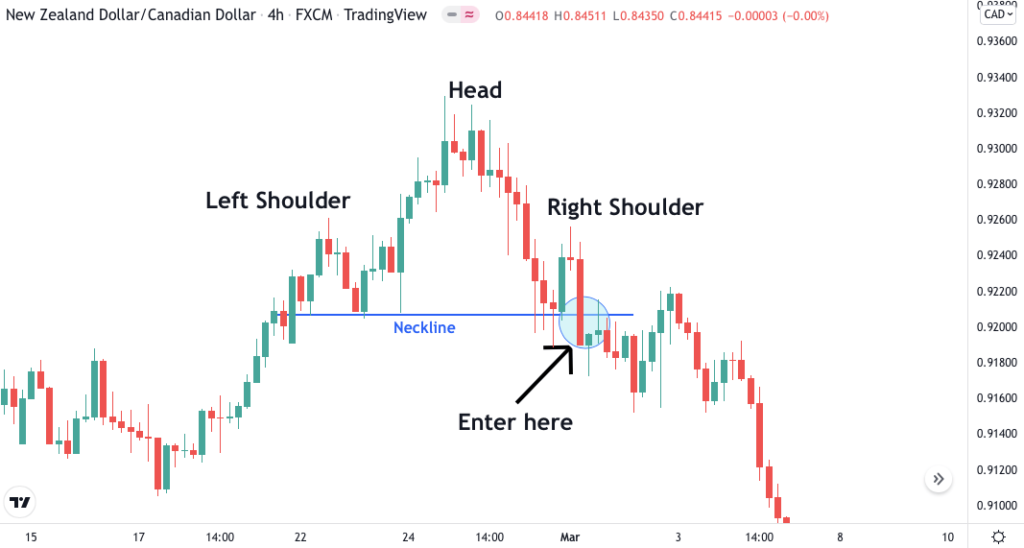
Most people wait until the candle closes for the period and then they will open a position. For example, if someone is looking at the 4-hour chart, they might wait until the 4-hour candle closes. Then if the market opens below the neckline in the next period, they will enter with a short position.
A short position means that you sell the currency pair instead of buying or “going long”. In forex, this is a simple procedure where all you need to do is click “Sell by Market” instead of “Buy by Market” in the order window.
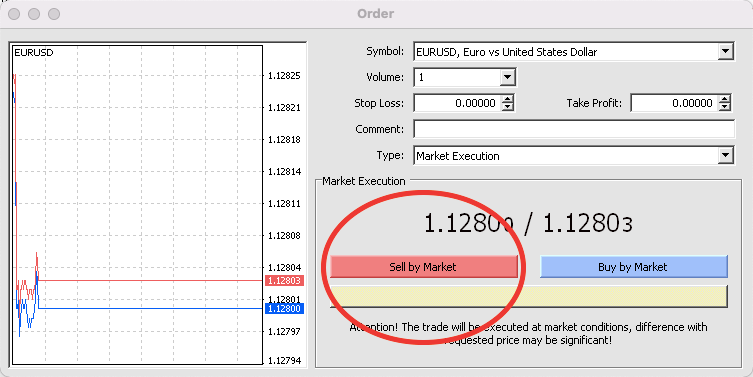
This simplicity is due to the fact that currencies are traded in pairs and every trade involves a simultaneous long and short position. For example, if you long the EUR/USD pair, you buy euros with dollars, which is the same to say that you sell dollars to buy euros or short the dollar and long the euro.
The process is more complicated for stock traders because before they can short a stock, they must borrow it from their broker. The borrowed stock is then sold on the market and later repurchased in order to return it to the broker.
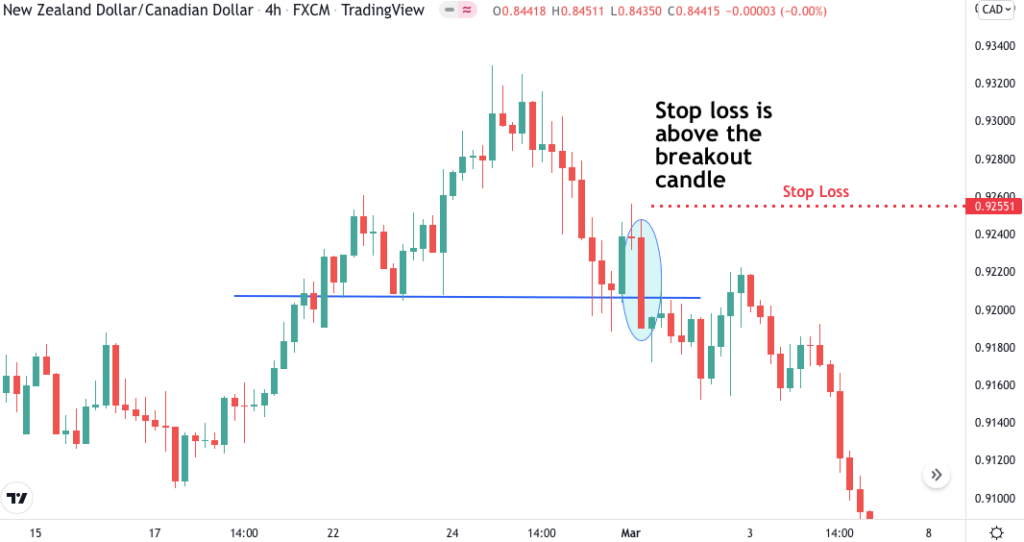
Almost every trader will place a stop loss order to protect themselves from adverse price movements. We highly recommend that you do the same. If you prefer a tight stop, use the price level slightly above the breakout candle.
If you want to leave a bit more breathing room for your trade, consider placing your stop loss above the head.
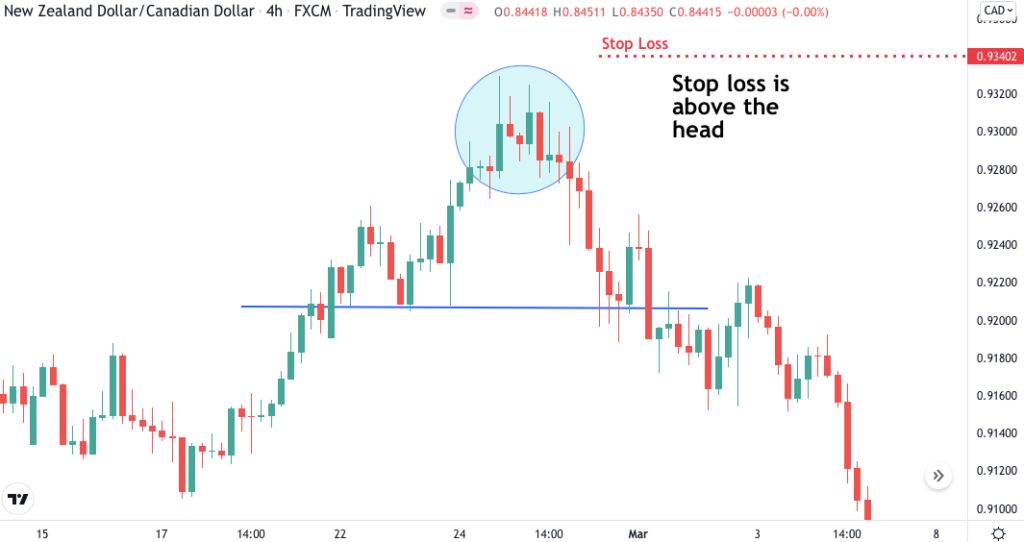
This will decrease the likelihood that your position will be stopped out prematurely, but you will need to decrease the position size to keep risking the same percentage as you would with a tight stop.
Head and Shoulders Pattern Target
To find the head and shoulder target price, first measure the distance between the head and the neckline. Next, take this distance and subtract it from the neckline breakout level to arrive at the profit target.
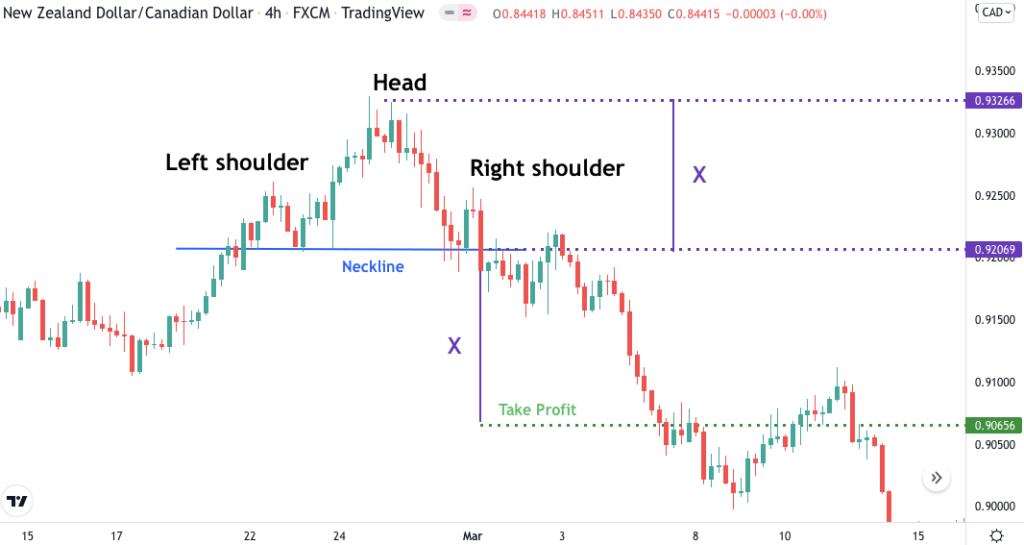
We usually subtract the height of the pattern from the price level at the close of the breakout candlestick, not from the price level of the neckline, but you can do it either way.

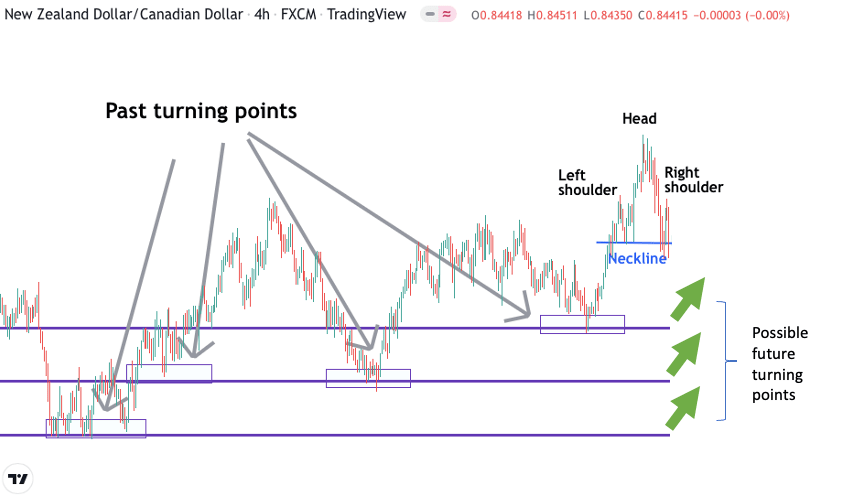
Another way to calculate the profit target is to choose an exit point based on the market structure. This requires more experience as you need to be able to estimate how far the new trend might travel and where it might change direction.
Of course, there are many other ways to calculate the profit target.
It’s also worth mentioning that there’s absolutely no rule that you must have a target price. Some traders might unwind their positions after a fixed number of days or hold on to them until market conditions change markedly.For instance, carry traders specialize in buying high yielding currencies with low yielding currencies. If a head and shoulders pattern allows them to get into such a position, they will try to stay in it as long as possible because the interest rate differential will be deposited in their trading account every day by the broker.
In a nutshell: there’s no right or wrong way of doing things in forex. You can do whatever works for you.
Failed Head and Shoulders Patterns
In a world where everybody shows winning patterns, it’s easy to think that all you need to do is find a few simple formations on your chart and the market turns into a money machine.
Needless to say, that is not the reality.
With losses largely left unmentioned, anyone who trades head and shoulders patterns will quickly realize that failure is quite common.
For instance, let’s take a look at the image below:
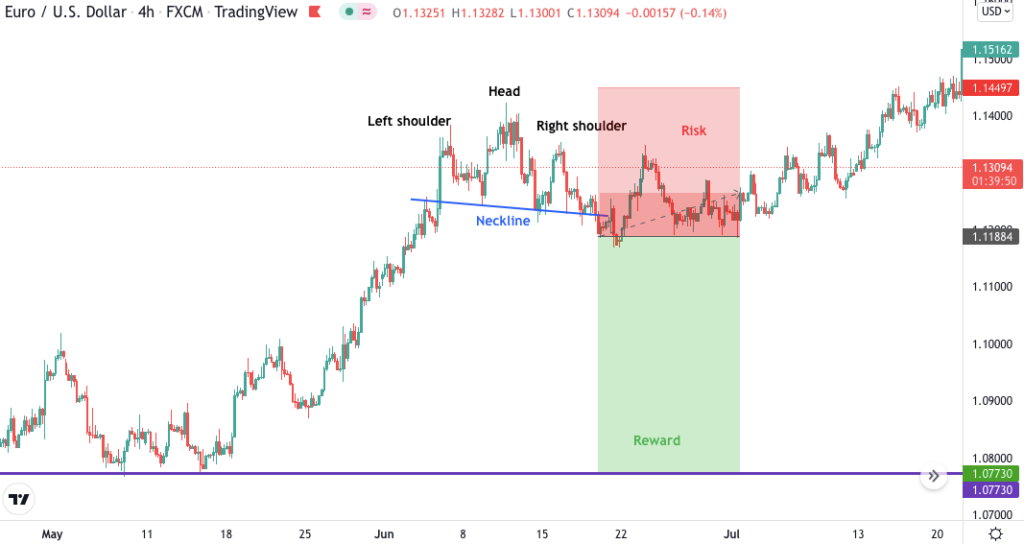
Everything looked great.
First, the pattern began unfolding after an extended run up in prices. Then, there were long upside wicks at the left shoulder and head showing that the market struggled to advance beyond these high prices. Finally, the price broke below the neckline with a strong bearish candle.
Despite being a seemingly perfect opportunity to go short, if you had sold the market at this point, you would have suffered a loss. Your stop would have been triggered even if you had placed it if far from the entry price.
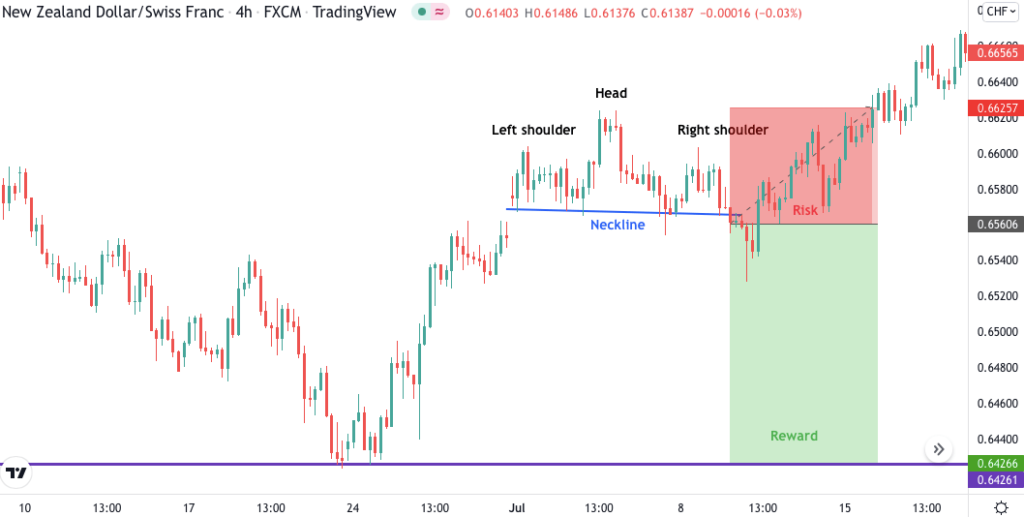
Here’s another example of a similarly misfortunate situation:
Obviously, we don’t show you these failed patterns to discourage you,but we think it’s important to set your expectations right. Head and shoulders are no silver bullet.
How Profitable Are Head and Shoulders Patterns? Should You Trade Them?
It’s not easy to find studies on chart patterns but we were able to dig up two. None of them are particularly up-to-date, but arguably not much has changed about how people trade chart patterns.
The first study was conducted by no other than the Federal Reserve Bank of New York. The researchers from the FED evaluated the predictive power of the head and shoulders pattern from March 1973 to June 1994.
The results are very surprising.
In essence, they found that trading head and shoulders patterns would have been significantly profitable if one had speculated in multiple currencies simultaneously during the investigated time period.
The full study is available on the bank’s website, so feel free to take a closer look.
The second study we found was one that appeared in Applied Economics in 2003. Unfortunately, this study is not free but the abstract is quite telling:
For various combinations of the building blocks of head-and-shoulder definitions the result is generally negative: returns to head-and-shoulder trading rules are not significantly positive —and if there is any evidence for non-zero returns at all, then it is evidence for negative returns.
This is pretty much the exact opposite of what the FED found.
So, what’s the deal with head and shoulders? How can you decide if you should trade them or not?
The answer is: you must figure it out yourself through backtesting.
Studies seem to forget that chart patterns are not high-probability signals on their own. Rushing to open a position when they emerge isn’t always good as we’ve seen with many failed head and shoulders patterns out there.
These types of patterns are merely frameworks that help bring structure to the market, manage risk, and project potential profits.
Every trader has a different approach to trading and no study can provide conclusive evidence in favor or against different patterns.If you feel confident trading these patterns, we’re sure you can build a winning system around them. It might take some time, but you’ll eventually get there. If you hate trading head and shoulders, there’s no reason you need to use them.
The Inverse Head and Shoulders Pattern
Also called head and shoulders bottom, the inverse head and shoulders pattern is simply the opposite of the traditional head and shoulders.
This means that the defining criteria, as well as the entry rules and profit target rules, are all reversed.
Inverse head and shoulders patterns occur following a downtrend. Their primary characteristic is a sequence of three troughs with the lowest in the middle. The left and right troughs are referred to as “shoulders” and the center trough as the “head”.
The straight line connecting the highs separating the head from right and left shoulders is called the “neckline”. The inverse head and shoulders pattern is complete when the price crosses the neckline after forming the right shoulder.
In addition to these basic features, there are a few criteria you should keep in mind when spotting inverse head and shoulders patterns:
- The neckline should be either horizontal or moderately sloped.
- The pattern must be horizontally symmetrical. This means that the time between the right shoulder and the head must roughly correspond to the time between the left shoulder and the head.
- The price must break above the neckline in a relatively short time period after forming the left shoulder. The time required for this should be no longer than the time between the formation of the two shoulders.
Of course, all inverse head and shoulders patterns exhibit some diversity. Individual situations can vary, but you should keep these points in mind as general guidelines.
Conclusion
The head and shoulders pattern can foreshadow the impending reversal of a rising market, so you want to be on high alert when market conditions change.
Heads and shoulders patterns form when the market stops making higher highs and higher lows (the primary characteristic of an uptrend), and begins making lower highs and lower lows (the primary characteristic of a downtrend).
The way you use this information is up to you. If you bought the currency pair previously, you might consider taking profits. If you’ve been sitting on the sidelines, you might start thinking about selling the market.
If you decide to open a trade based on the pattern’s signal, make sure to always manage your risk with a stop loss. That way, even if you run into a failed head and shoulders pattern, the loss will be cut off before it could turn into a serious threat to your trading account.