Traders are constantly tuned in to ever-changing market conditions, keeping an eye on shifts in market sentiments and trends.
Chart patterns are pretty good at equipping you with information about the current state of the market and the potential shifts that are underway.
In this blog, we’ll unpack how to use double top and double bottom forex patterns to trade reversals.
A reversal is simply a change in the price direction of a currency pair. Following an uptrend, a reversal would be to the downside. Following a downtrend, a reversal would be to the upside.
So if you’re exited about trading double tops and bottoms and catching new trends, you’ll love this guide.
The guide is structured as follows:
- What is the Meaning of Double Top Pattern?
- What is the Meaning of Double Bottom Pattern?
- How to Identify Double Top Patterns (Step by Step)
- How to Identify Double Bottom Patterns (Step by Step)
- Double Top Pattern Entry
- Double Bottom Pattern Entry
- Combining Double Top and Double Bottom Forex Patterns with Other Tools
- Frequently Asked Question About Double Tops and Double Bottoms
Use the links to quickly navigate to the sections that pique your interest, or read the whole guide if you’re completely new to these patterns.
Let’s dive in!
What is the Meaning of Double Top Pattern?
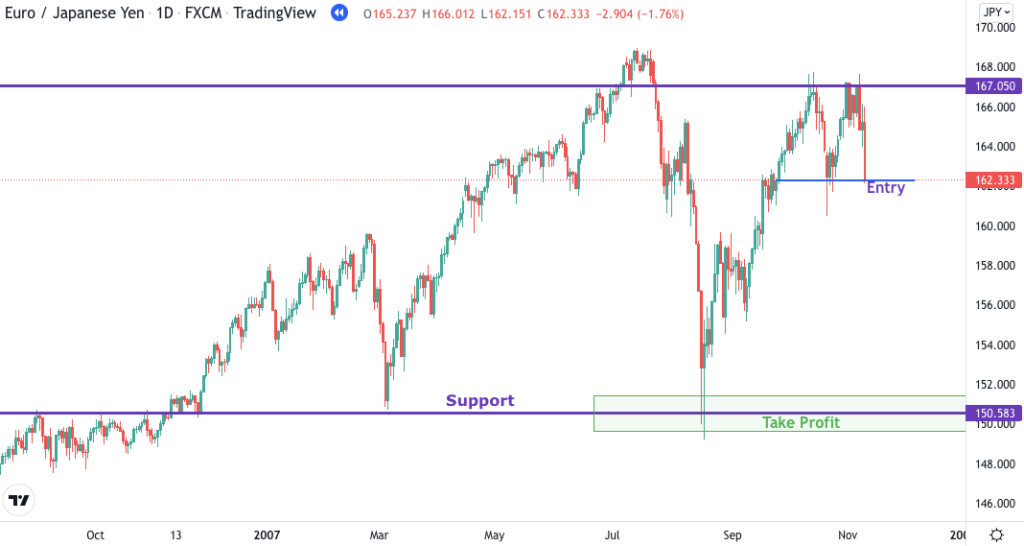
The double top formation pattern is a signal of a weakening uptrend. On a graph, this is marked by a distinct “M” shape that occurs when the market repeatedly fails to reach a new high.
Unlike the ‘head and shoulders’ pattern, which is less strict in definition, the double top is based on a clearly visible resistance; in other words, the double top occurs when the price reaches a “ceiling” and begins to fall.
The weekly chart of the EUR/USD below shows a double top that formed over several months.
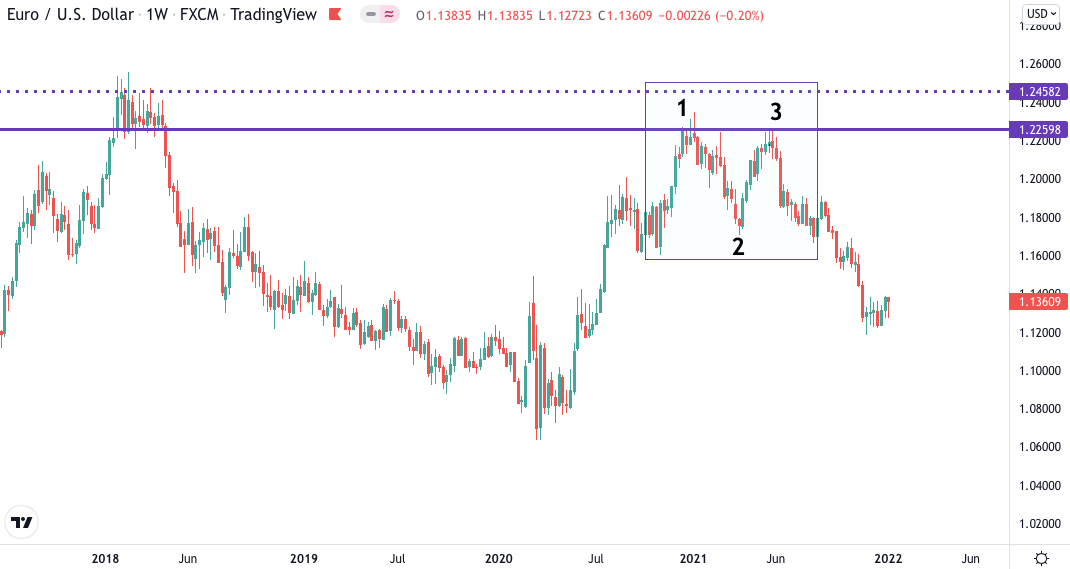
Prices corrected from their January highs (1) to their March lows (2). Note that the highs met resistance at a previous congestion zone formed years earlier in 2018.
(Congestion is a market situation where the demand is matched by supply. This results in the price not moving significantly, making the price action consolidated or look congested.)
The May highs (3) matched those from January and the market is currently trending down.
What is the Meaning of a Double Bottom Pattern?
People often ask if the double bottom pattern is bullish or bearish.
A bullish pattern predicts that the price of the currency will rise. A bearish pattern signals that the price will go down.
The double bottom pattern is a bullish formation. The reason some people are confused is that the double bottom occurs during a downtrend. The key thing to notice is that it occurs when sellers repeatedly fail to drive the price to a new low. Therefore, the double bottom has a characteristic “W” shape and signals a potential reversal to the upside.
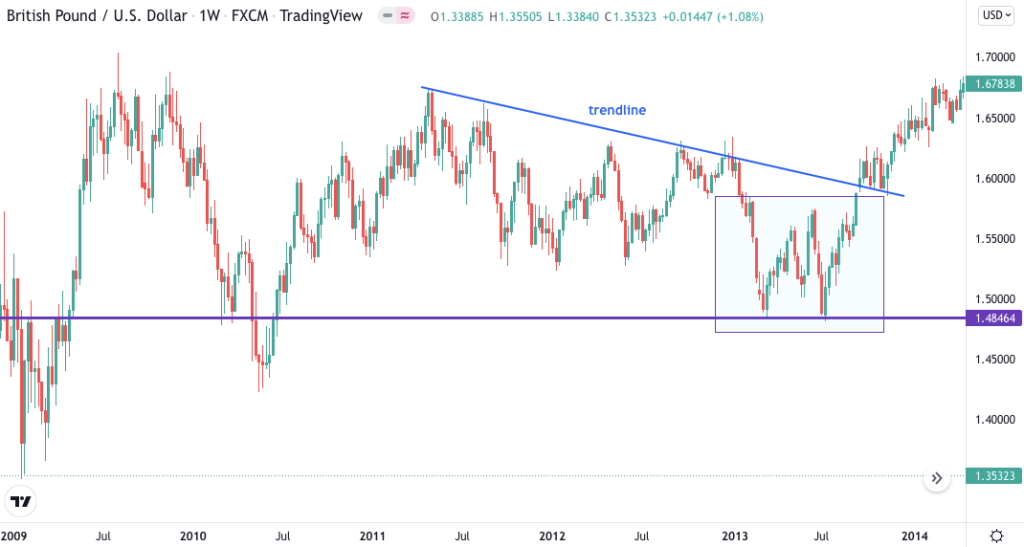
Below, you’ll find a double bottom formed on the weekly GBP/USD chart:
These might include other price patterns, moving averages, pivots, support or resistance levels, trendlines and Fibonacci levels. When some or all of these tools give the same buy or sell signal, it is a good way to confirm the validity of your trade.
We’re going to teach you how to use double top and double bottom forex patterns in conjunction with other technical analysis tools later in this guide. For now, let’s continue with a step-by-step guide to identifying these patterns.
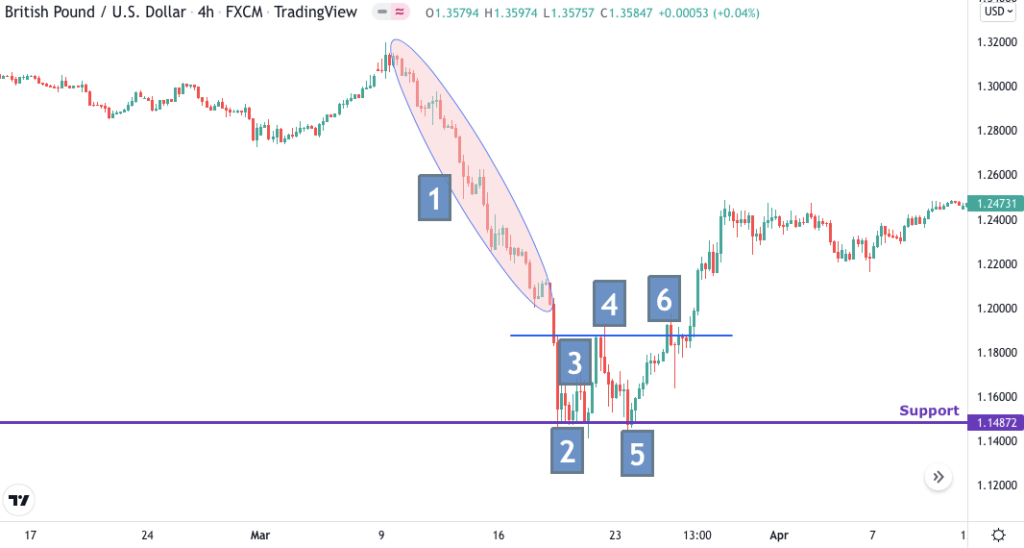
How to Identify Double Top Patterns (Step by Step)
Struggling to find a reliable method for identifying double top patterns? Consider our 6-step approach and the image below to put things into perspective.
- Look at the price action prior the double top. Since double tops act as bearish reversal patterns, you should wait to see an uptrend, otherwise there’s nothing to reverse.
- The first peak forms when the price reaches a resistance level and bounces off. The peak rarely consists of a single candlestick. Instead, the price usually prints multiple candles, forming a more rounded looking peak.
- The first peak is followed by a temporary decline. There’s no rule about the extent of this price move, but a larger drop is preferable because if there is only a brief pause it might be that the trend is strong, and the market is gearing up for a breakout.
- Once the market begins to rise again, draw a horizontal line at the low point of the decline. This line is often called the neckline of the pattern; essentially, it marks a support level (a price level that the price does not fall below for some time) and will help you time your entry and manage your risk.
- When the price returns to the initial resistance level it must bounce again to form the second peak. The two peaks should appear near the same price. Beware that if the tops are spaced far away from each other, the market might be entering a sideways trend (a horizontal price movement) thus the double top will be less reliable.
- You must wait for the price to fall below the neckline. When this happens, the pattern is completed, and you can enter the market with a short position to catch the potential reversal.
How to Identify Double Bottom Patterns (Step by Step)
Now that you have learned how to trade double top patterns, it’s time to talk about double bottoms. Consider our 6-step approach and the picture below to learn how to identify double bottom patterns.
- Look at the price action prior to the double bottom. Since double bottoms act as bullish reversal patterns, you should wait to see a downtrend, otherwise there’s nothing to reverse.
- The first valley, or “bottom”, forms when the price reaches a support level and bounces off. The valley rarely consists of a single candlestick. Instead, the price usually prints multiple candles forming a more rounded looking valley.
- The first valley is followed by a temporary advance. There’s no hard-and-fast rule about the extent of this price move, but a larger increase is preferable because if there is only a brief pause it might be that the trend is strong, and the market is about to drop below the support level.
- Once the market begins to fall again, draw a horizontal line at the peak of the advance. This line is often called the neckline of the pattern. It essentially marks a resistance level (a price level that the price does not rise above for some time) and will help you time your entry and manage your risk.
- When the price returns to the initial support level it must bounce again to form the second valley. The two valleys should appear near the same price. Beware that if the bottoms are spaced far away from each other, the market might be entering a sideways trend (a horizontal price movement) thus the double bottom will be less reliable.
- You must wait for the price to close above the neckline. When this happens, the pattern is completed, and you can enter the market with a long position to catch the potential reversal.
Double Top Pattern Entry
So by this point, you should have an idea of how to identify double top patterns. Now we’re going to tell you what to do when you spot one.
It’s important to note that there is no one-size-fits-all solution when it comes to trading double tops. Rather, there are numerous ways in which you can incorporate them into a trading system which aligns with your personality, goals and circumstances.
That said, there are a few key things you should consider before making a double top pattern entry.
The Risk
Every time you open a trade, there is the risk that the market will go against you. Chart patterns are far from infallible, and even a seemingly perfect set-up can let you down.
That’s why defining the risk before any double top trade must be at the forefront of your mind.
Forex traders usually use ‘stop loss orders’ to automatically close losing trades. In the case of the double top, the stop loss order is placed somewhere above the current market price. Should the market continue to rise, the position will be closed out when the stop is reached.
It’s entirely up to you where you place your stop loss.
An intuitive place would be above the resistance, but this only works if you’re planning to capture a large price move, otherwise the risk-reward ratio will be terrible (more on that later).
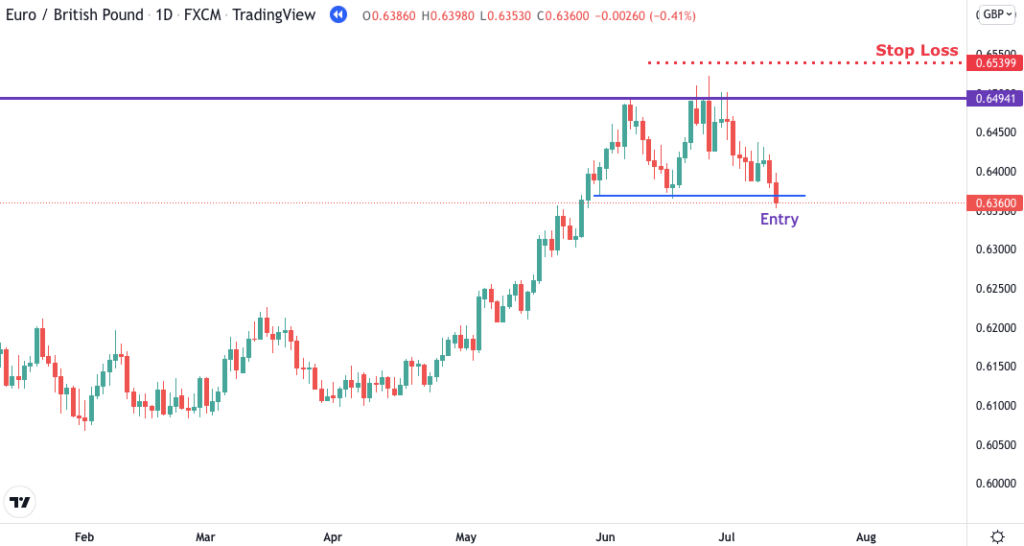
If you want to be more flexible, you might also use market volatility. This means adjusting the stop distance depending on the market activity. That is, using a wider stop when there are large price swings and a tighter stop when the market is quieter.
(A tighter stop is simply one that is closer to the entry price and vice versa for a wider stop.)
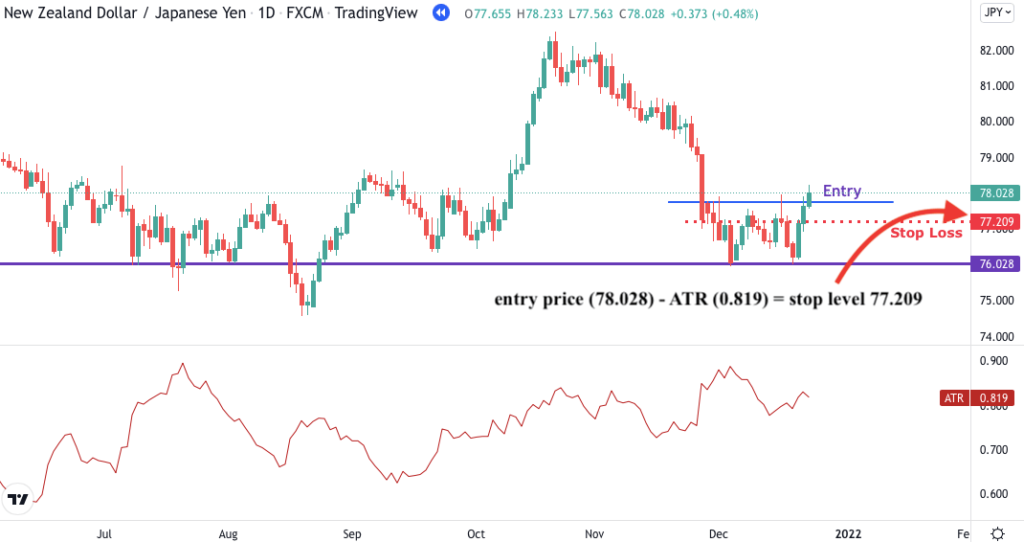
Forex traders usually assess the market volatility with a technical indicator called Average True Range or (ATR). The ATR shows how much the price will move during a given time frame.
For example, someone trading the daily chart might decide to set his stop at 2x ATR, meaning he is ready to close his position at a loss if the market move against it is 2 times the normal daily price move.
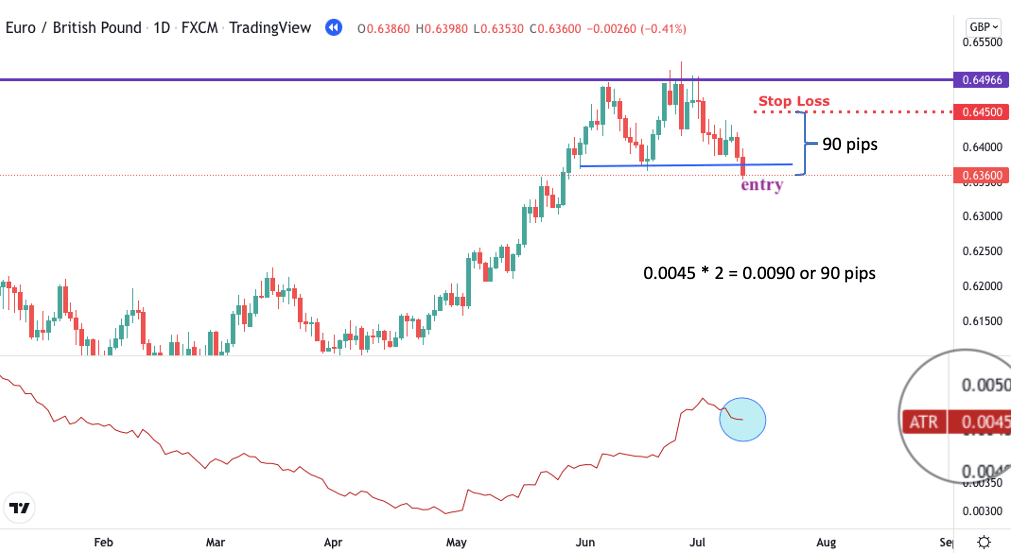
In this case, it would take 2 days of normal adverse price action to reach the stop loss. It is, however, possible that the stop loss will be reached much earlier if the uptrend begins to recover rapidly.
Besides deciding on a way to place your stops, another important aspect of risk management is ‘position sizing’. You must make sure to size your position so that the distance between the stop loss and the entry price represents the value you are prepared to lose.
Going into position sizing would be a lengthy departure from our topic, but you can use this simple calculator from BabyPips.
The Reward
This is the good part.
Planning a double top trade would be incomplete if you only thought about the potential downside. Sure, protecting your account is essential, but accumulating profits is also important. After all, that’s why you’re trading in the first place, isn’t it?’

Establishing a double-top-pattern target price serves two primary objectives:
First, it helps you to weigh up the risk against the potential reward and see whether it is worth to open the trade in the first place. Second, it will help you overcome the psychological urge to close your winning position prematurely.
The equivalent order to the stop loss here is the ‘take profit’. Placing the take profit is also very subjective with no hard rules whatsoever.
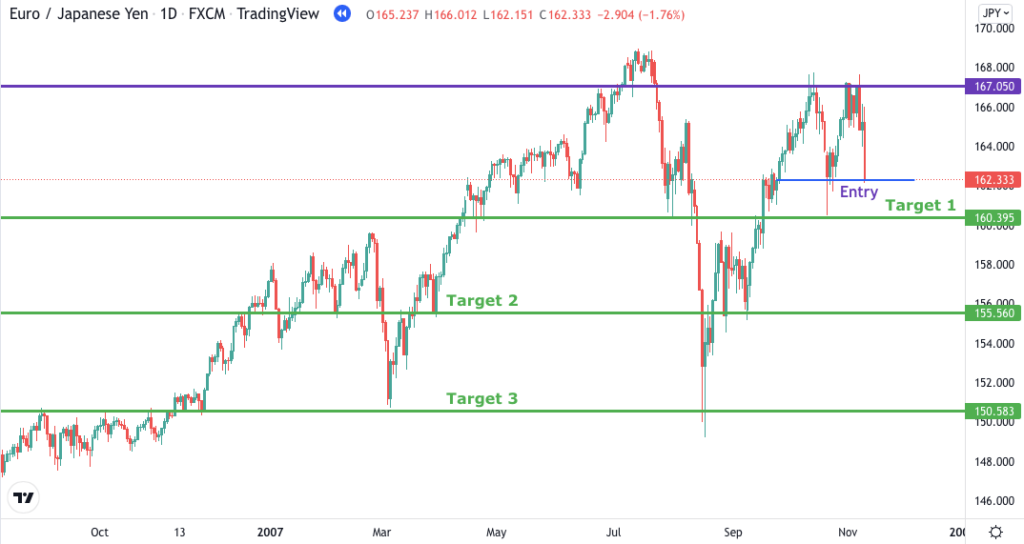
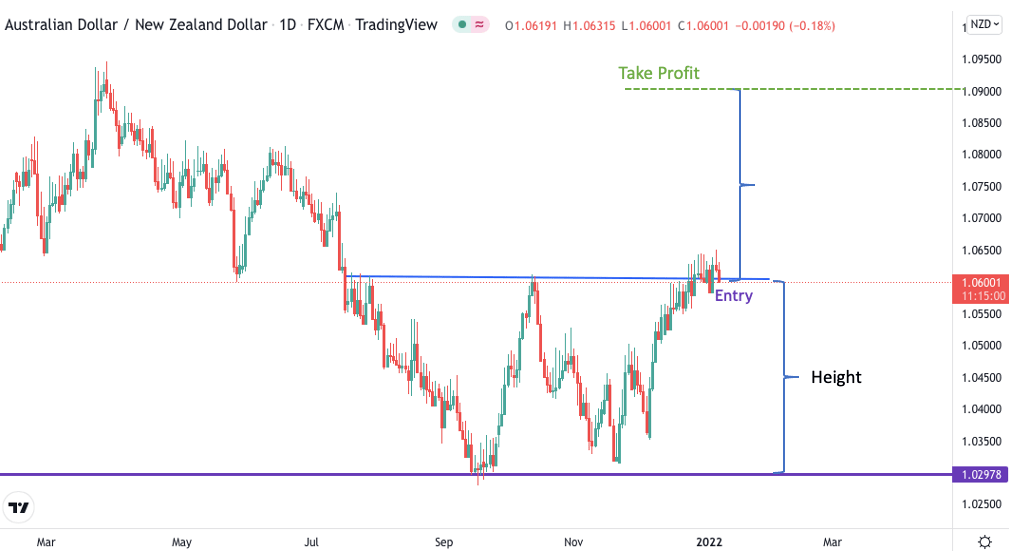
A general rule of thumb given to beginner traders regarding the double-top-pattern target price is that the height of the pattern can be projected to the entry point to find the profit target.
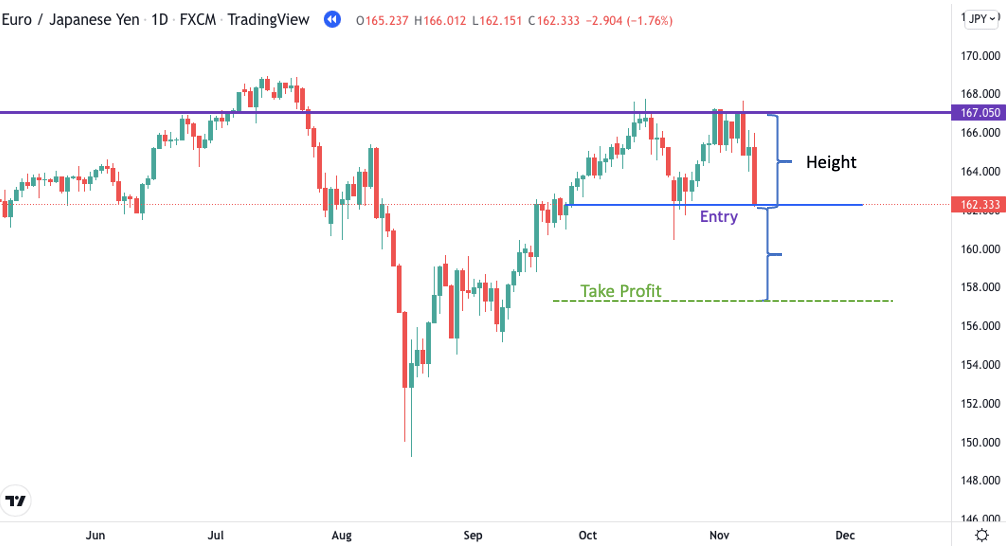
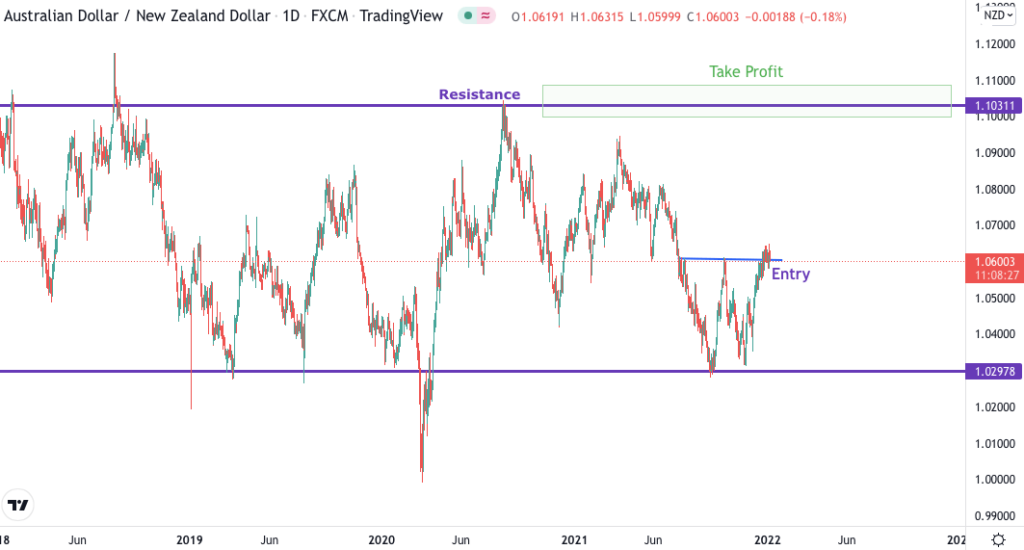
While this is a profoundly convenient method, the close proximity of a target price to the entry point established this way makes it difficult to catch a significant market reversal. If that’s your goal, you might benefit from targeting a major support zone instead.
The term ‘major support’ simply denotes a noticeable price level that has recently reversed a downtrend or that has caused multiple such reversals in the past.
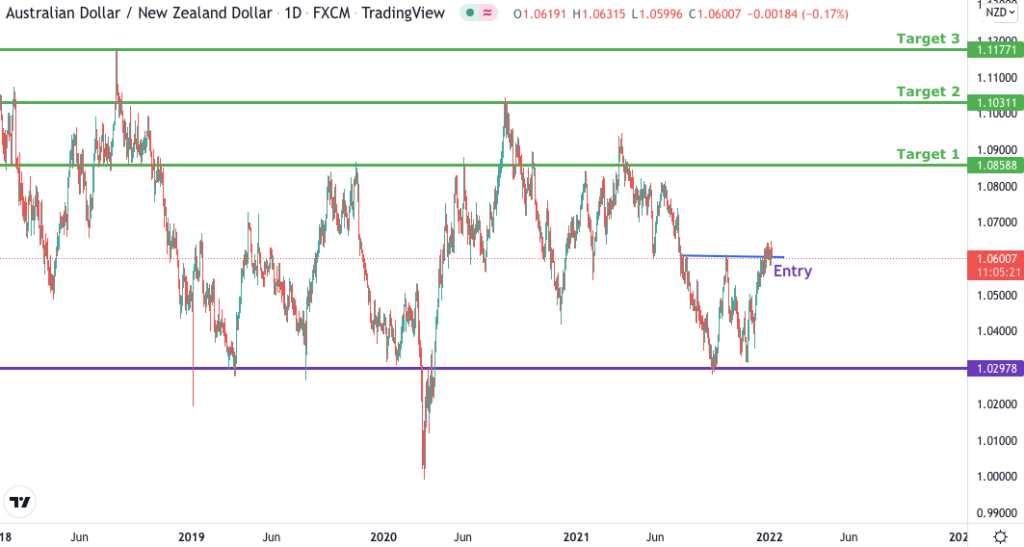
It is also possible to target multiple support zones and close a portion of your position each time a target is hit. This method of exiting trades is referred to as ‘scaling out’, and it allows you to lock in smaller profits while the market is moving your way, with the trade-off that your original max profit is reduced.
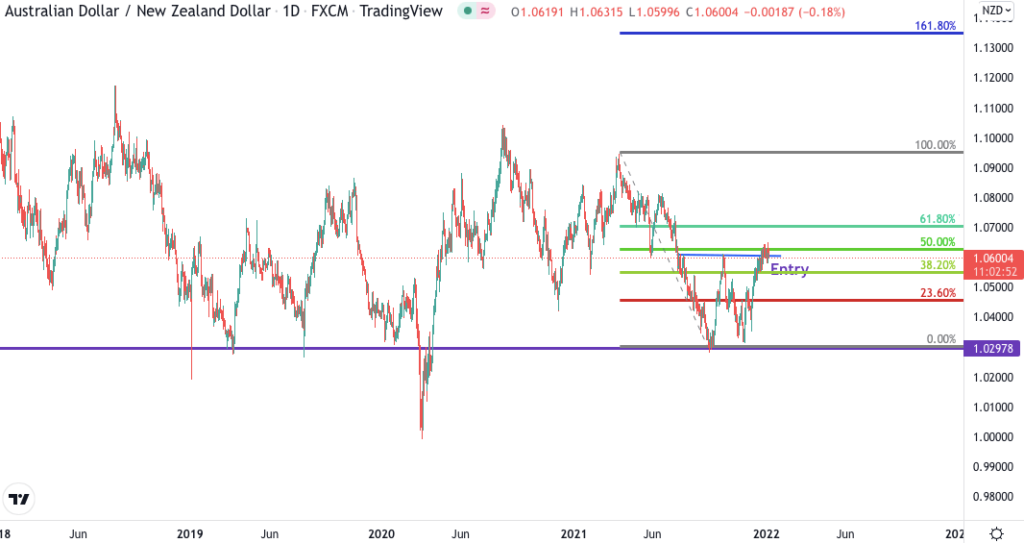
Another popular method for identifying double-top-pattern target prices involves using a tool called the Fibonacci retracement.
Fibonacci retracements provide a more objective method of identifying key levels of support and resistance. These levels can be derived mathematically, but almost every charting package contains a Fibonacci tool which you can use to plot them on your chart with ease.
If you want to apply Fibonacci retracements to your double top trade, you must simply connect the low point of the uptrend with the highpoint of it, and the Fibonacci levels will automatically appear on your chart.
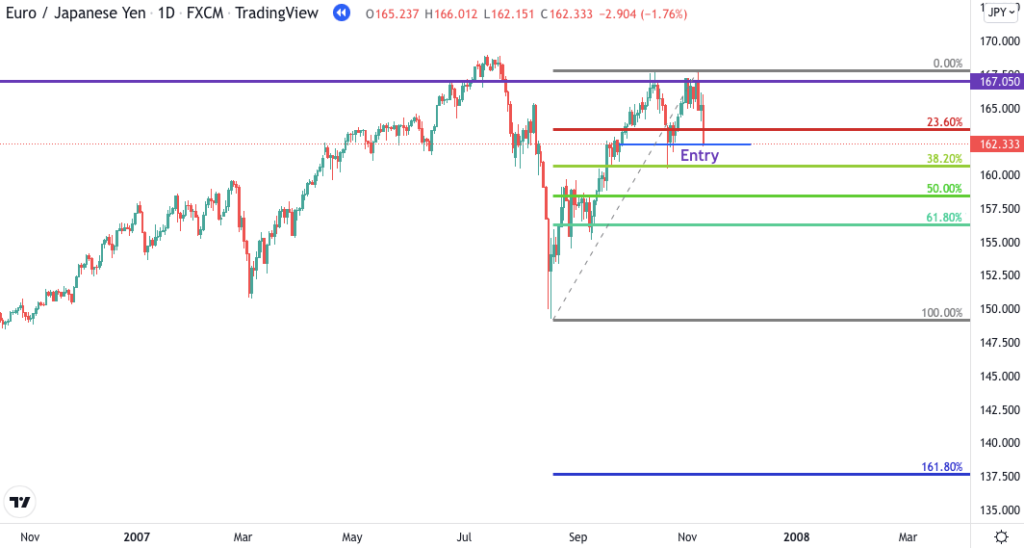
Then, similar to using manually defined support levels, you can decide on which Fibonacci number will be your profit target, or whether you would like to take partial profits.
The Risk Reward Ratio
The risk to reward ratio (RRR) is exactly what it sounds like; it puts into perspective the risk on the trade (the amount you’re prepared to lose) and the reward on the trade (the amount you expect to gain). For example, if you risk $100 to make $300, you have a 1:3 RRR.
Naturally it is better to open trades where the profit potential outweighs the risk.
This happens when the RRR is below 1. Sticking with our previous example, 1:3 can also be expressed as 0.33. If you risk $200 to gain $100, the RRR would be 2:1 or 2.0, which is not necessarily ideal.
All this is simple and intuitive. Yet, opening trades with a proper risk reward ratio is easier said than done. The key is to commit yourself to a minimum RRR in your trading plan and be disciplined while the trade is open.

Just think about it:
Most people sitting on a winning trade get nervous that the market might reverse and take away whatever small profit they have on their position. They are very likely to close the trade prematurely and leave a lot of money at the table.
The very same people will hold on to losing trades for an eternity hoping that the market will turn around and everything will be fine.This kind of behavior creates a return asymmetry where gains are kept small due to the tendency to close winnings prematurely, and losses are relatively large due to the delay in recognizing bad trades.
By using a stop loss order and a profit target you can easily circumvent this issue. And using a minimum RRR before opening the trade adds an additional layer of security – ensuring that the risk is worth the reward.
Double Bottom Pattern Entry
Double bottoms are identical to double tops, except that everything is in reverse. There’s no superior strategy or silver bullet, but there are numerous ways in which you can incorporate these patterns into a sensible trading system.
Before any double bottom pattern entry, you must make the same considerations as before: you must define the risk, the potential reward and decide whether the relationship between the two is adequate.
In the following section, we’re going to elaborate on these aspects a little more.
The Risk
We’re all too familiar with failed double tops; every time you open a trade, there is the risk that the market will go against you. No matter how perfect your set-up looks, there’s no escape from the uncertainties of the market.
That’s why defining the risk before any double bottom trade is essential.
It sucks to lose money, but since it’s an unavoidable part of trading, it’s infinitely better to keep your losses small and meaningless than to allow them to become large and destructive.
A stop loss is designed to allow you to mitigate this risk without having to constantly monitor the market. It’s an order that you can place with your broker and which will automatically close a losing position once the price reaches a predefined level.
In the case of the double bottom, the stop loss order is placed somewhere below the current market price. Should the market resume the downtrend, the position will be quickly closed out.
How quickly the position is closed depends on where you place your stop loss, which is an entirely subjective decision.
An intuitive place would be below the support level, but this only works if you’re planning to capture a large price move, otherwise the risk-reward ratio will be unfavorable.
Supporters of technical indicators might employ the ATR indicator to get a sense of market volatility and set their stop losses accordingly, once again, using a wider stop during periods of high market volatility and a tighter stop when the volatility is low.
So, this was a quick introduction to the kind of risk management preparation you should do before a double bottom pattern entry. Don’t forget the importance of position sizing as highlighted earlier. Risk only a small percentage of your trading account on each trade and you should be just fine.
The Reward
In addition to planning for the downside, you must have a clear plan for the upside.
Way too often people find themselves in the fortunate position of having the market go their way, just to realize they don’t know how and when to exit the position.
This can lead to all sorts of mistakes. That’s why establishing a target price (or multiple target prices) for your double bottom trade is just as important as setting a stop loss.
It will not only help you weigh up the risk against the potential reward, but it will also allow you to decide on a target price beforehand. This way, you can avoid making decisions out of frustration and closing your winning position prematurely.
Traders use take profit orders, which are similar to stop losses just the other way around.
A general rule of thumb given to beginner traders is that the height of the pattern can be projected to the entry point to find the double bottom pattern target price.
While this is a simple approach, it is often better suited to short-term traders. If you want to trade market reversals, often the target price will be too close to the entry point and compromise your ability to hold your position for a longer time to benefit from the new trend. In this case, targeting a major resistance zone might make more sense.
The term ‘major resistance’ simply means a noticeable price level that has recently reversed an uptrend or that has caused multiple such reversals in the past.
It is also possible to scale out of your position through targeting multiple resistance zones and close a portion of your position each time a target is hit.
Another popular method to pick your double bottom pattern target price(s) is through using the Fibonacci retracement tool.
We have already discussed how the Fibonacci can serve as an objective method for highlighting key levels of support and resistance. If you want to apply Fibonacci retracements to your double bottom trade, you must simply connect the high point of the downtrend with the low point of it, and the Fibonacci levels will automatically appear on your chart.
Then you can decide which level you want to use as your profit target.
The Risk Reward Ratio
Whether we talk about double tops, double bottoms, or any other chart patterns, the RR is always the same; it denotes the relationship between the risk on the trade (the amount you’re prepared to lose) and the reward on the trade (the amount you expect to gain).A trade that risks $100 to make $300 has a 1:3 RRR and is favorable over a trade that risks $200 to gain $100 with an RR of 2:1.
So, while you should generally abstain from risking more than you stand to gain, the acceptable minimum RR will always depend on your strategy. We encourage you to backtest your system and experiment with different RRs to see which works best.
Combining Double Top and Double Bottom Forex Patterns with Other Tools
Technical analysis is the study of patterns of past market data. Finding a trade opportunity from one technical analysis concept such as the double top is great, but it is even better when there are more of such concepts coming together at the same point in the market.
Needless to say, if multiple non-correlated techniques confirm the validity of a set-up, the chances of your trade working out successfully are higher. This is the essence of creating a trading strategy.
You have already begun to see how a structured approach can benefit your trading. We have showed you ways to manage your risk based on rational decisions and to establish profit targets. These all serve to help you grow your account over time.
In addition to these, most trading strategies contain rules regarding confluence, in order to have the best possible edge before entering a trade. This simply means that a valid trade signal occurs when multiple technical analysis concepts occur at the same time.
Confluence can be found in all forms, limited only by your decision on which factors you deem important to consider. Price patterns, candlestick patterns, moving averages and trendlines can all be combined, just to name a few. The result is a complex trading signal that combines more than one trading technique to increase the odds of winning on a trade.
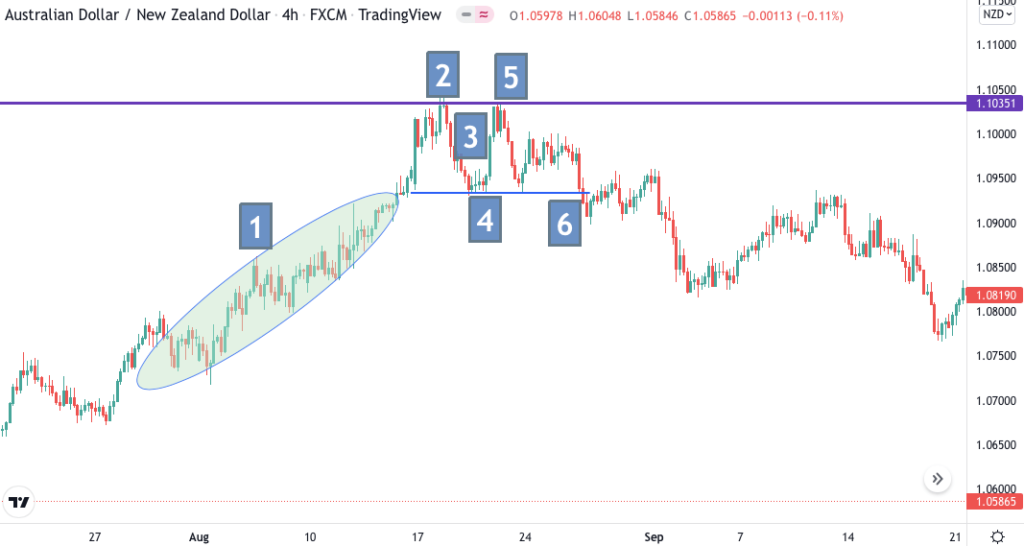
Here is an example on the CAD/JPY chart to show you how confluence trading works.
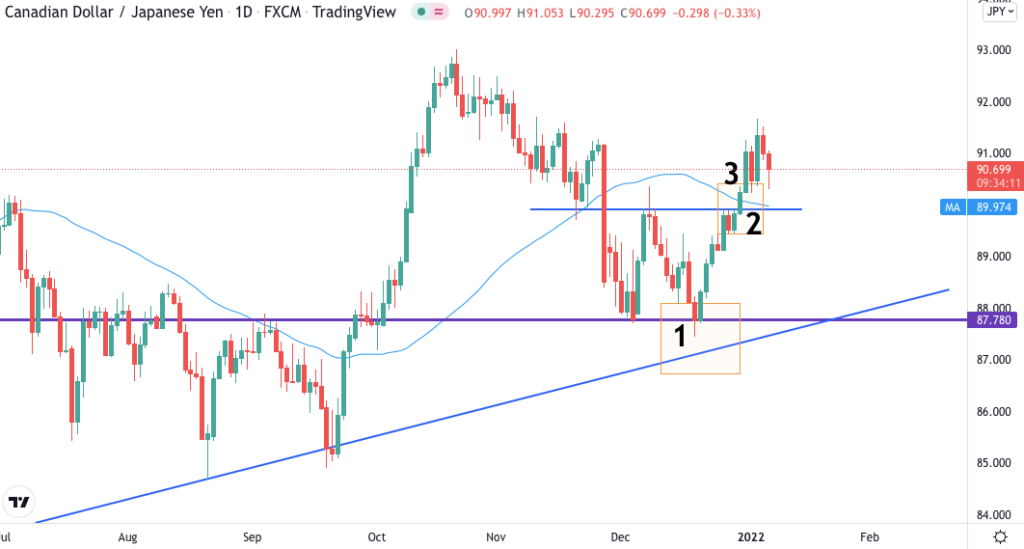
A double bottom pattern is formed on the daily timeframe from Dec 2021 to Jan 2022 with a long entry at ~90. Notice that where the double bottom forms there is not only a significant support level, but also at a major trendline (1).
The second label (2) marks the point where the neckline is broken with a strong bullish candle. This candle resembles to the Japanese Marubozu candlestick pattern. You can learn more about the Marubozu and other candlestick patterns here.
Finally, the neckline break is also accompanied by a break above the 50-period Simple Moving Average (3). This has traditionally been regarded as a bullish signal.A trader might only open a position if all three of these signals are present reinforcing the validity of the double bottom set-up. We’re not saying that you should do the same, but trading solely with chart patterns may not be the best choice. Rather, using other tools alongside these pattern setups may result in more profitable trades.
Frequently Asked Questions About Double Tops and Double Bottoms
No. The double top pattern occurs in an uptrend, but it is bearish because it signals the weakening of the uptrend. It has a distinct “M” shape that occurs when the market repeatedly fails to reach a new high.
No. The double bottom pattern occurs in a downtrend, but it is bullish because it signals the weakening of the downtrend. It has a distinct “W” shape that occurs when the market repeatedly fails to reach a new low.
As a rule of thumb, you can measure the height of the pattern and project it to the entry point to find the pattern’s target price.
Because double top and double bottom patterns are subjective trading tools, it is hard to find a reliable empirical evaluation regarding their accuracy. By combining more than one trading technique, you can increase the odds of winning your trades.
Conclusion
Double top and double bottom forex patterns provide a great way to capture potential market reversals. However, you must be careful to treat them as tools and not expect them to solve all your trading problems.
By using these patterns to construct a trading strategy, you might gain an edge over the market and make money from forex.
But always remember that successful trading goes beyond patterns and indicators. You must have an edge over the market, but you must also be disciplined and consistent.