
- Fundamental Analysis
- Technical Analysis
- Sentiment Analysis
- Which Type of Forex Market Analysis Is the Best?
Fundamental Analysis
Just like we did at the beginning of Forex Trading: The Ultimate Guide, let’s take a glance at the stock market for a minute.
In the stock market, fundamental analysis is the analysis of every factor that can have an important effect on the examined company’s true value.
For example, company management, financial conditions or the overall health of the industry in which the company operates.
Here’s the theory:
A stock is not just a ticker symbol or an electronic blip. It’s an ownership interest in an actual business, with an underlying value that does NOT depend on its share price.
So, in plain English:
The market swings between optimism and pessimism, which makes stocks undervalued or overvalued from time to time.

The goal is to find companies that are trading at a discount.
How does this relate to Forex?
Well, the process is somewhat similar.
Instead of businesses, fundamental Forex traders analyze countries to describe the global atmosphere that influences supply and demand of currencies and other financial assets.
In other words, they try to determine which economies are doing well and which are doing poorly.
Then, they use this data as an indication of where exchange rates could be headed.
Here’s how it works:
If a country’s current or future economic outlook looks positive, then their currency should strengthen.
Why?
Because that country will eventually become a more alluring place to invest, but foreign investors first have to purchase that country’s currency to be able to do that.
More demand results in higher prices and vice versa.
It is as simple as that.
What factors should I consider in my Forex fundamental analysis?
Believe us, there are plenty of them, but it all boils down to two things:
Political events and economic data.
There isn’t too much to say about political events, but it can get blurry when it comes to what kind of economic data we are talking about.
So, let’s break it down.
Interest Rate Announcements

Interest rates serve as a point of reference for what investors expect to earn when investing in a specific country.
The result?
Interest rate changes made by any of the global central banks are the biggest influencers that drive the Forex market.
Let’s see how it works:
Each currency has its own interest rate, which typically reflects the health of individual economies.
When the economic growth starts to overheat, central banks tend to hike rates in order to stop the emerging inflation problems.
Higher rates mean that borrowing becomes more expensive, which reduces investments and slows down economic growth in general.
However, there’s the good news:
The returns available to those who put their money into that country get larger.

Because of this, the price of that currency will probably go up as foreign investors shift their assets to that country to gain higher returns.
The appreciation in the exchange rate eases inflationary pressures.
Problem solved.
On the other hand, when the economy is struggling, central banks tend to cut rates to encourage lending and inject money into their economy.

The effect?
Lower rates typically stimulate borrowing and investment, but it will be relatively less attractive to save money in that country.
Because foreign investors would get a better rate of return in another country, there will be less demand for that currency.
In other words, the exchange rate will depreciate.

See how that works? Interest rate hikes tend to result in higher exchange rates and interest rate cuts tend to result in lower exchange rates.
By the way, it’s not just the current level of interest rates that matter.
In fact, interest rate expectations are even more important than the current rates because they’re already priced by the market.
For instance, a currency may have a high interest rate now, but market expectations of lower interest rates in the future often cause that currency to depreciate.
Financial websites such as Bloomberg can help you stay up-to date.
Employment Figures
Employment figures are also one of the primary drivers of a nation’s currency.
First of all, employment directly affects consumer spending. People don’t buy as much if they’re unemployed.
Second, consumer spending affects inflation, which as we have already talked about, plays an important role in determining interest rates.
Typically, a booming economy has many employment opportunities and low unemployment figures.
On the other hand, when unemployment is high, the economy is likely struggling.
While different countries have different statistics, from an international perspective, the U.S. Employment Situation Report is the most important.
It consists of a set of surveys regarding the labor market; however, the component you must keep an eye on as a Forex trader is the non-farm payroll employment.
Generally referred to as the NFP report, it shows the number of jobs obtained or lost outside of the agricultural sector.
According to Investopedia, the total NFP report accounts for approximately 80% of the workers who produce the entire gross domestic product (GDP) of the United States.
So, it’s a good signal whether an economy is improving, overheating or shrinking.
Therefore, the NFP can suggest the probability of an eventual rate hike or cut.
In addition, at Wall Street, the NFP is considered the benchmark labor statistic.
So, the market reaction is almost always HUGE.
The report is usually released on the first Friday of each month and covers the prior month.
Better-than-expected numbers can easily create a bullish market for the USD while disappointing data can lead to the greenback’s weakening.
Consumer Price Index
Just like the NFP, the American Consumer Price Index is also an important piece of financial data that’s reported on a monthly basis by the U.S. Bureau of Labor Statistics.
However, instead of showing employment data, it reflects the increased cost of living, or in other words, inflation.
The CPI uses a “basket of goods” approach.
The prices of essential goods and services (such as clothing, medical care, transportation, etc.) are collected by BLS statisticians and figuratively put into a basket.
Then, based on consumer spending habits, different items in this basket get different weight to make the CPI even more accurate.

The whole process results in the CPI index, which reflects the average increased costs of the total basket over a period of time.
In most cases, a higher CPI reading suggests the economy is going through a phase of inflation.
In this case, prices have increased compared to the previous measure, but the average consumer’s income may not be able to compensate for the higher prices.
Or at least, not as fast, so the average standard of living declines.
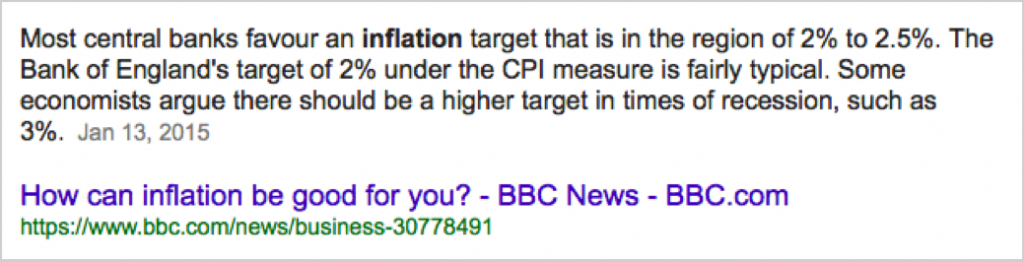
Nevertheless, inflation is not always a bad thing.
In fact, moderate levels of inflation are even needed to drive consumption as higher levels of spending are crucial for economic growth.
A lower or flat CPI reading signals a period of deflation.
It is a condition in which the cost of living decreases.
Don’t get carried away here.
It’s sound like a good thing, but actually, a deflating economy is in a very poor condition.
Deflation occurs when the money supply has been reduced for some reason and customers therefore can do nothing but cut back on their spending.
The lower demand forces retailers to lower their prices, but it also means lower profits for them.
We know this won’t break your heart, but listen:
Since they don’t have enough money, they have to cut wages, lay off employees, etc.

If these issues remain unresolved, things can easily turn worse, even into an economic depression.
Okay, so it’s not that great.
Considering all the described aspects, it probably does not come as a surprise that the CPI is a major determinant of interest rates for central banks.
Therefore, the Forex market is sensitive to any changes in the index as traders often use it as an early warning of changes in central bank policy decisions.
Trade Balance Numbers
Finally, let’s see the Trade Balance Report.

In essence, it shows the value of exported goods and services minus the value of imported goods and services by a country over a certain period.
A while back, we talked about reports like the CPI and NFP.
Well, in terms of importance, the Trade Balance Report is not on the same level with these.
However, it is relevant for Forex traders.
Why?
Because it can help to determine the basis for currency trends.
Let us explain:
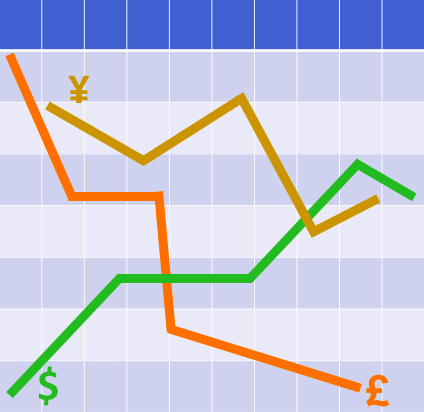
When a nation exports more than it imports (aka trade surplus), there’s a high demand for its goods and services.
Thus, there’s a high demand for its currency as well.
For example, let’s say there are more products exported from the Eurozone to the U.S. than imported.
In this case, the EUR/USD will likely appreciate because more euros are being bought against dollars to pay for the foreign exports.
(Remember, the exchange rate shows the first currency expressed in the second.)
In other words, the United States’ demand for euros surpasses Europe’s demand for dollars, causing the value of the USD to fall against the EUR.
Conversely, a nation that imports more than it exports(aka trade deficit) tends to have a relatively less demand for its currency, which causes it to lose value.
It is as simple as that.
The judgement of the Trade Balance report always depends on how it fits into the overall economic situation.
Most countries aim to create an economic environment that has trade surplus, but sometimes a trade deficit is the more favorable balance of trade.
In reality, it’s like choosing between a broken arm or a broken leg; the ideal situation would be a balanced trade but that rarely happens.
How to Keep Up with Fundamentals?
We suggest you use an economic calendar.

An economic calendar is just like it sounds: A calendar that features upcoming economic events.
At ForexSpringBoard, we love to use Forex Factory’s calendar because of its high-quality and reliability.
(And it’s completely free.)
Keep an eye out for upcoming announcements, meetings and speeches of influential people.
However, if you’re a short-term trader, you don’t have to go nuts about them.
Fundamentals are behind long-term price trends that can be found on weekly or monthly charts.
Concentrate only on high-impact news and specifically on their release dates rather than the exact meaning behind the numbers.
If you know the release dates, you know when to expect unusually huge price swings.
In general, you’re better off staying away from trading during those times.
Technical Analysis
In currency trading, technical analysis is the way of analyzing the past behavior of a currency pair in order to anticipate its future direction.
It’s not a secret that the trading community loves technical analysis.
However, it wasn’t always this way.
Although it has been around for as long as there have been organized markets, most traders didn’t accept technical analysis as a viable tool for making money until the late 1970s or early 1980s.
When they did, it turned out to be a HUGE game-changer.
Here’s why:
Technical analysis keeps the trader focused on what the market is doing now, instead of focusing on what the market should be doing based solely on economic circumstances.
It’s because it presumes that all currently available market information is incorporated by the price and has already been reflected via the price action.
Simply put, if the guiding principle in real estate is “location, location, location,” in technical analysis it’s “price, price, price.”
By using different tools of technical analysis simultaneously, you will be able to determine where to enter the Forex market with the highest probability and when and where to get out.
(Which is even more important.)
Let’s see what you need to know to start your technical analysis journey:
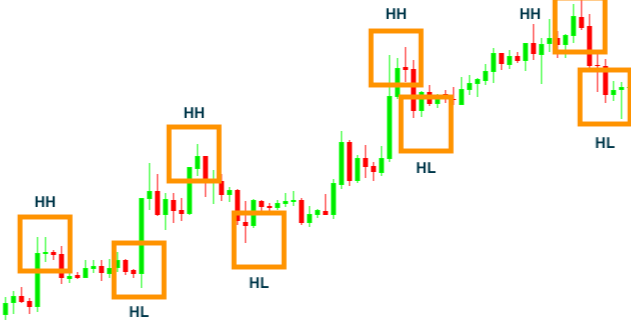
What Is a Trend in Forex?
The trend is the general direction in which a currency pair is heading.
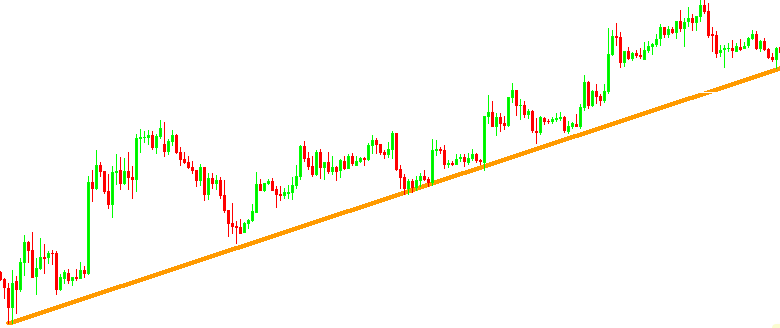
In an uptrend, you will see “higher highs” and “higher lows.”
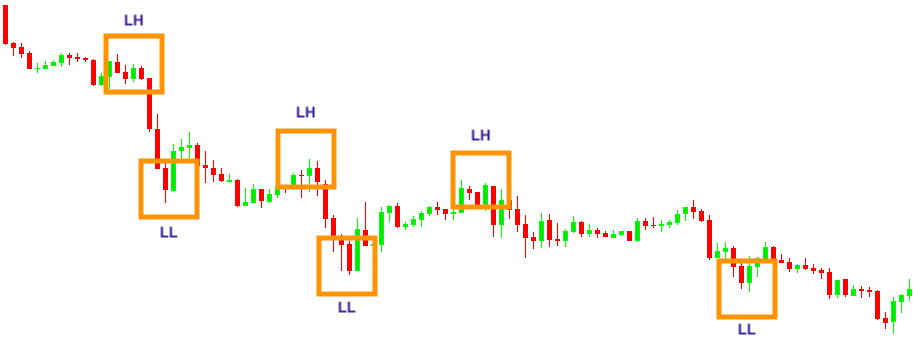
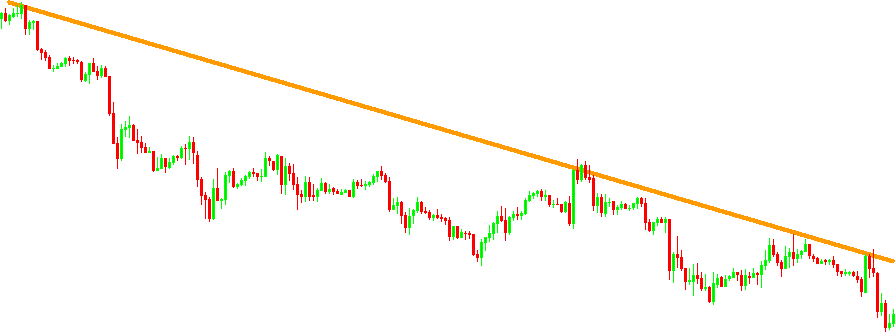
In a downtrend, you will see “lower highs” and “lower lows.”
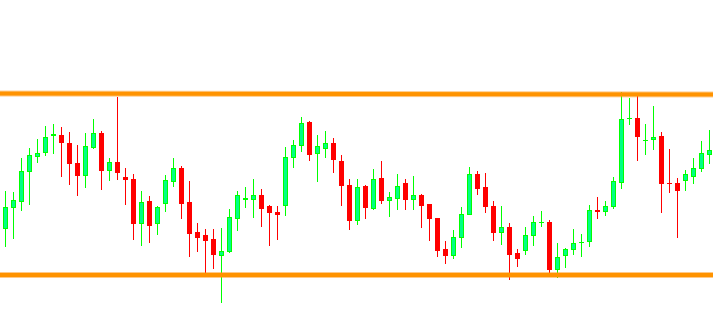
Also, there will be times when there is no clear direction, like here:
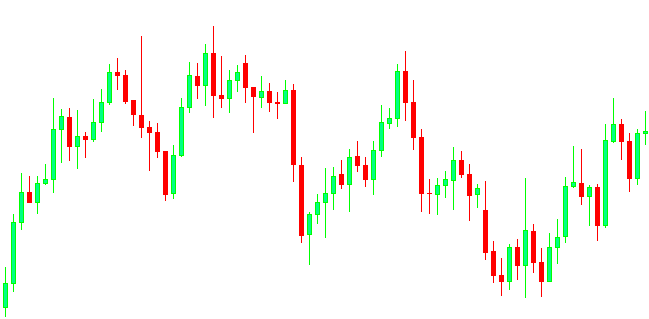
This is called a sideways trend.
Trading in the direction of the trend is way easier and that’s why identifying the prevailing trend is so important.
You can easily do that by drawing trendlines on your chart.
To draw an uptrend line, connect at least three low points by a straight line.
Same thing goes for downtrend lines, but you need to connect highs.
In essence, the more times price touches a trend line, the better it is.
(Trendlines act as resistance or support lines; we’ll talk about these soon.)
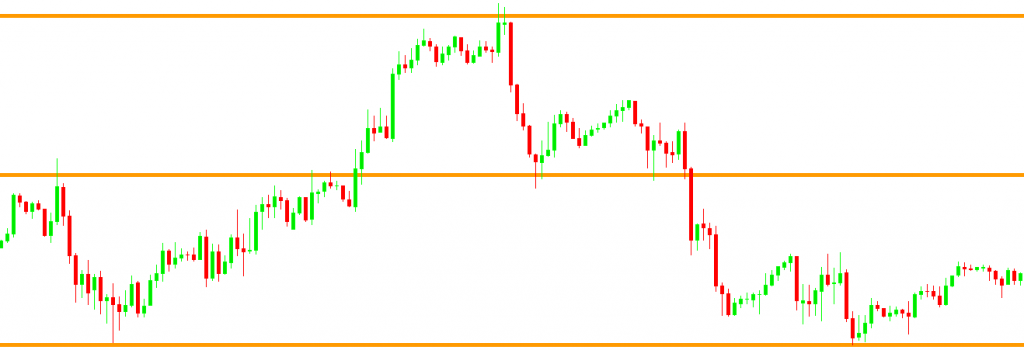
Sideways trends can be worth trading if they’re range bound.
It simply means the price is “bouncing” between two horizontal zones that have a relative wide distance between them.
We have a very simple trading strategy you can use to take advantage from ranges:
Okay, here’s something you need to be aware of when it comes to trends:
Different timeframes might have different trends.
What?
Before you fall into the state of “analysis paralysis,” here’s a simple tip:
Only analyze three time frames.
Let’s take an example:
After some demo trading, you realize you feel most comfortable looking at the 4-hour chart.
When it comes to analysis, the first thing you can do is to move up to check out the weekly chart of a currency pair.
This will help you determine the overall trend.
Then, you can move one step lower to the daily chart and locate smaller moves within the broader trend.
Finally, you can head back to your preferred 4-hour chart, to look for entry points into trend direction.
Question: How to find entry points?
Read on…
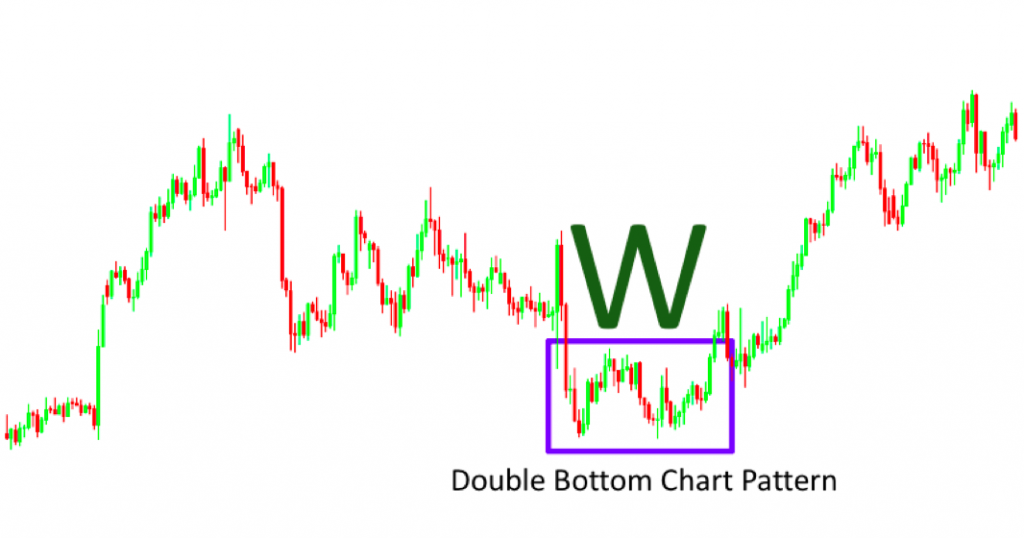
What Are Chart Patterns?
Chart patterns are behavior patterns.
Here’s the thing:
According to technical analysis, prices driven by human nature that don’t change over time.
The result?
As people act and react in a similar way as they did in the past, there are certain behavior patterns that repeat themselves with statistical reliability.
These are observable in forms of different chart patterns.
Chart patterns give a clear indication of when there’s a greater probability of one thing happening over another.
In other words, they can help you decide whether a trend is likely to continue or reverse.
Over the years, technical analysts have identified numerous different patterns.
And now, you only have to take the time to learn and practice them.
To make your job even easier, we created an advanced guide on chart patterns.
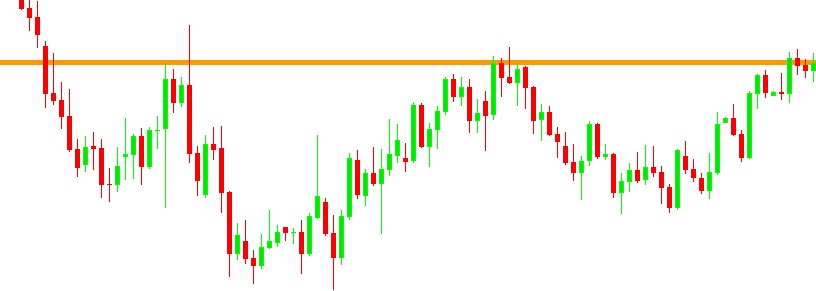
What Is Support and Resistance in Forex?
If you open the chart of any currency pair, you’ll see there are certain areas where price has paused or changed direction in the past.
An area where selling was strong enough to interrupt or reverse an uptrend is called resistance.
Conversely, an area where buying was strong enough to interrupt or reverse a downtrend is called support.
Now, here’s the reason why you should care about this:
Past support and resistance areas are expected to work in the future.
It makes sense if you think about it:
If traders remember that prices have recently stopped falling after hitting a certain bottom, they’re likely to buy when prices approach that level again.
In the same way, if traders remember that an uptrend has recently reversed after rising to a certain peak, they’re more likely to sell when prices approach that level again.
So, you can use these areas for your own benefit.
Here’s how:
First, mark them with horizontal lines on your chart.
Pro Tip: Instead of extreme prices, draw your support and resistance lines across the edges of overcrowded areas. These are the areas where masses of traders have changed their minds.
Second, buy at support and sell at resistance.
Make sure you keep an eye out for additional signals, such as chart patterns, to increase your chances of a winning trade.
You also need to know that support and resistance can change their roles.
When the price passes through a resistance, that resistance becomes a support and vice versa.
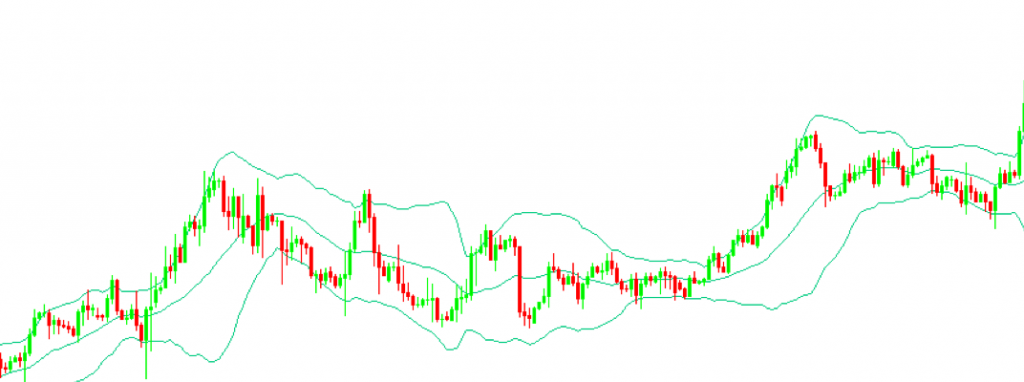
What Are Technical Indicators?
Finally, we have technical indicators.
These are created to show where the price is going or whether it’s oversold or overbought.
he great thing about technical indicators is their objectivity.
You can argue whether a chart pattern is present, but there’s never an argument about an indicator’s direction.
When it points up, it’s clearly up, and when it points down, it’s clearly down.
We have an entire guide on technical indicators; make sure you check it out.
Sentiment Analysis
The third main type of Forex market analysis is the sentiment analysis, which has long been a tool used by traders across different areas.
The meaning of the word “sentiment” is a view or attitude toward a situation or event; in markets, it refers to the collective feelings and emotions of the market participants.
Sentiment is very important, not just in Forex but in any given market.
Fear and hope remain the same; therefore, the study of the psychology of speculators is as valuable as it ever was. ~ from Reminiscences of a Stock Operator by Edwin Lefèvre
Sentiment literally tells us:
People HOPE the value of a currency pair will increase so they are buying. Let’s prepare for an uptrend.
Or,
People are AFRAID that the value of a currency pair will decrease so they are selling. Let’s prepare for a downtrend.
And that’s why knowing the prevailing market sentiment is important.
You may be convinced that the dollar should go down, but if everyone else thinks differently, there’s nothing much you can do about it.
You can’t go straight against the crowd.
Instead, you can adopt a longer-term contrarian approach.
The goal is to identify early shifts in the overall market consensus, so you can position yourself at the beginning of major trends.
How Can I Measure Market Sentiment?
You can utilize Forex sentiment indicators.
Sentiment indicators do not provide exact buy or sell signals.
Instead, they typically show the distribution of long and short positions in a currency pair. The idea is to help you determine when the majority of traders are either bullish or bearish.
The question is:
How is that possible if there isn’t a centralized exchange in Forex that gathers sentiment data?
Let’s see:
Commitment of Traders Report
It’s true that the vast majority of Forex instruments are traded via a dealer network, rather than a formal exchange, but currency futures are an exception.
The COT report consists of several simple reports; each of these essentially provides the number of long and short positions for the different types of futures contracts.
To access the most recent Currency Futures data, you need to head over to CFTC’s website, navigate to the Current Traders in Financial Futures Reports section and choose the Long Format Futures Only report.
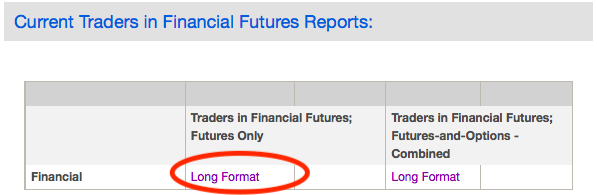
Let’s face it: The report isn’t the most visually attractive.
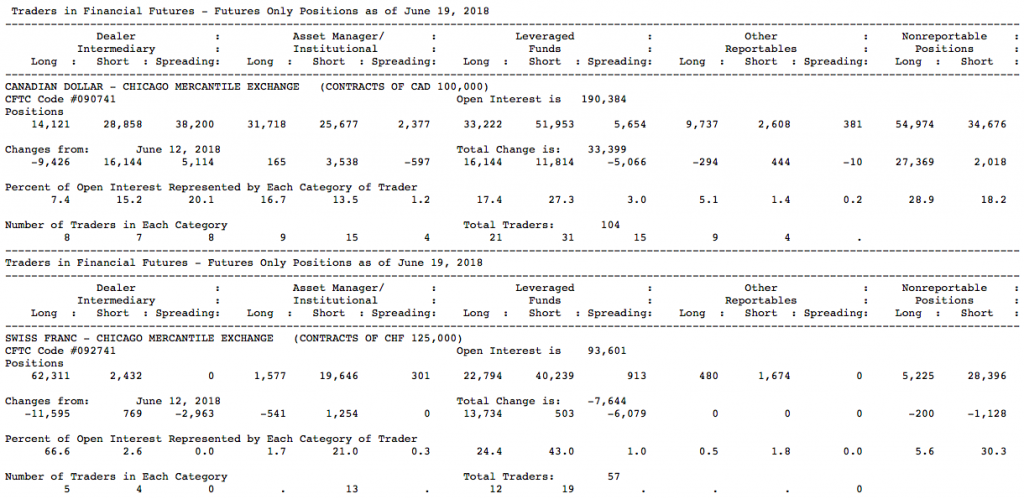
Fortunately, understanding the presented information isn’t that hard.
It shows how different types of traders have positioned themselves in the futures market.
Those traders who are required to report their activity are classified by CFTC into 4 categories:
Dealer/Intermediary
These are dealers and large banks who design and sell financial assets to clients. They use futures contracts as part of their pricing and risk balancing activities.
Asset Manager/Institutional
These are institutional investors (for example, pension funds or insurance companies) and those investment/portfolio managers whose clients are also mainly institutional.
Leveraged Funds
These are typically hedge funds and various types of money managers.
They have a wide range of strategies and may be engaged in conducting trading on their own interest in addition to trading on behalf of speculative clients.
Other Reportables
Other participants who are engaged in some sort of trading activity, such as covering business risk, but do not fit into one of the first three categories.
For example, central banks, smaller banks, credit unions, etc.
The positions of small traders who aren’t required to report their activity are shown under the nonreportable positions.
This data is not really important and also not accurate because most of the commercial trading takes place at the spot Forex market.
For more detailed information on the contents of the report, you can read the official explanatory notes here.
After all, the COT report is useful in obtaining a longer-term perspective on major capital flows.
However, it’s not very accurate for short-term trading because the data is delayed by a couple days.
Position Summaries by Broker
In addition to the COT report, Forex sentiment data can be obtained through certain Forex brokers who offer tools to show the positioning of their own clients.
Although these are not 100% accurate in terms of the whole market, they can give a relatively good indication of the overall sentiment.
In addition, many are updated in almost real-time, and therefore can be extremely useful to short-term oriented Forex traders.
Here’re our two favorite tools:
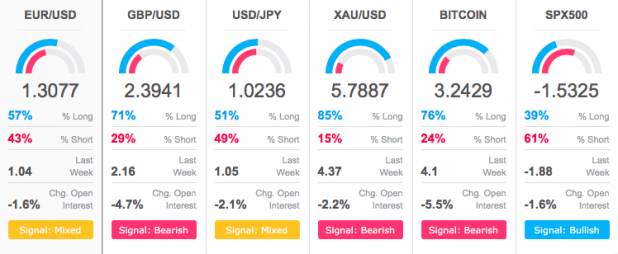
Speculative Sentiment Index by DailyFX.com
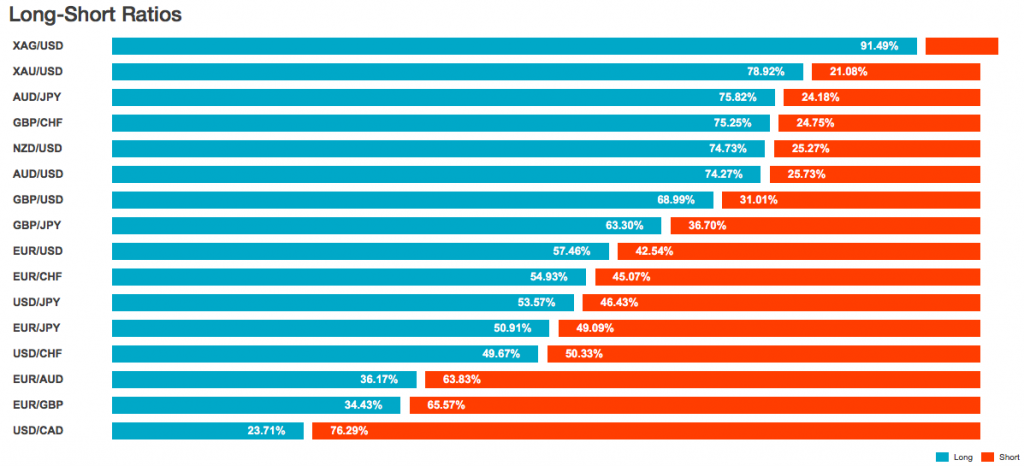
Long-Short Ratios by OANDA.
Which Type of Forex Market Analysis Is the Best?
The truth is, there is no such thing.
Taken the fact that each type of analysis concentrates on a different aspect, having a working knowledge of all three definitely won’t hurt you.
You can trade based on the type of Forex analysis you are most comfortable with, but it doesn’t mean you should completely ignore the other two.
BTW, we know that you want to hear something concrete.
So, here’s the deal:
For short-term traders, you should focus on technical analysis.
It’s more accurate in terms of what’s likely to happen in the near future because as you know it concentrates on what the market is doing now.
You don’t necessarily have to follow the details of fundamental events, but at least mark the date of important announcements on your economic calendar to be prepared for the flurry of activity that takes place at those times.
For longer-term traders, however, fundamental analysis becomes more, or at least equally, important.
It’s because fundamentals tend to be the reason of long-term price trends.
You also need to consider technical analysis to determine the best entry and exit points in the market.
And what about sentiment analysis?
It’s something that everybody needs to know a little bit.
Traders don’t always act in a rational manner; knowing when they’re too enthusiastic or too depressed can help both in the short-term and in the long-term.