
Without a doubt, the MACD is one of the most popular technical indicators.
But, what if you have no idea how it works?
We put together this guide to help you understand how to use the MACD indicator for Forex trading.
We are going to cover the following topics:
- What is MACD?
- Who created the MACD?
- MACD indicator formula
- How to trade crossovers with MACD
- How to trade divergences with MACD
- Different MACD indicator settings
- How to use the MACD in your trading strategy
- How reliable is using the MACD?
What Is MACD?
MACD is an acronym for moving average convergence/divergence.
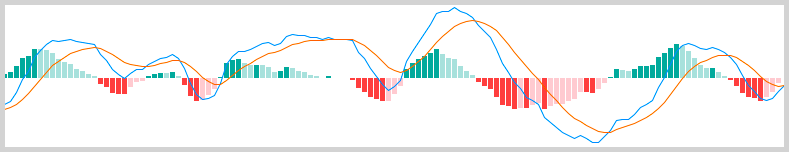
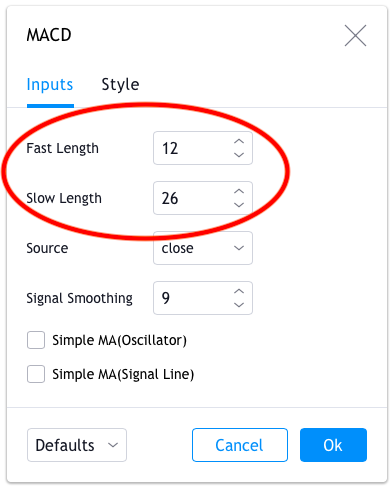
It probably comes as no surprise that the MACD is made up of different time-scaled moving averages, as you can see in the picture below:
In addition to the moving averages, most indicators also plot a histogram, which doesn’t have much of a role, but it looks good (we’ll talk about it later).
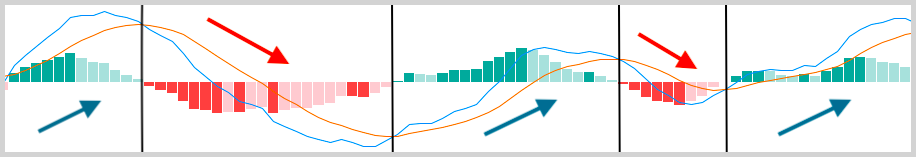
The different averages generate the trading signals as they converge, cross and diverge, hence the fancy name.
In essence, the MACD indicator shows the perceived strength of a downward or upward movement in price.
Technically, it’s an oscillator, which is a term used for indicators that fluctuate between two extreme values, for example, from 0 to 100.
When the value of the oscillator nears the upper extreme value, traders assume the currency pair is overbought, and as it nears the lower extreme, they assume it’s oversold.
Now you’re probably thinking, I just have to identify a price range and look for the MACD to spot buying or selling opportunities. Super-duper easy.
Well, it’s not that easy.
Unlike other popular oscillators, such as the RSI or the Stochastic Oscillator, the MACD doesn’t measure on a fixed scale.
In other words, it fluctuates between minus infinity and plus infinity.

The MACD is primarily used to trade trends.
Who Created the MACD?
The MACD was developed by Gerald Appel in 1979. The histogram that is often featured along with the indicator was introduced a bit later in 1986 by a fellow trader named Thomas Aspray.

Besides his remarkable work regarding technical analysis, Mr. Appel founded Signalert in 1973, a registered investment advisory company focused on capital preservation, income generation, and long-term asset growth.
He has more than fifteen books on different investment strategies, such as Stock Market Trading Systems, Opportunity Investing, and Winning Market Systems. On the top of that, his articles have appeared in publications such as Smart Money, Moneymagazine, Barron’s, and Stocks and Commodities.
Now, let’s do some math!(Or, you can skip this part and go straight to the usage of the indicator.)
MACD Indicator Formula
In order to talk about the MACD formula, first, you need to understand the concept of an exponential moving average (EMA).
Don’t worry. It’s not difficult at all.
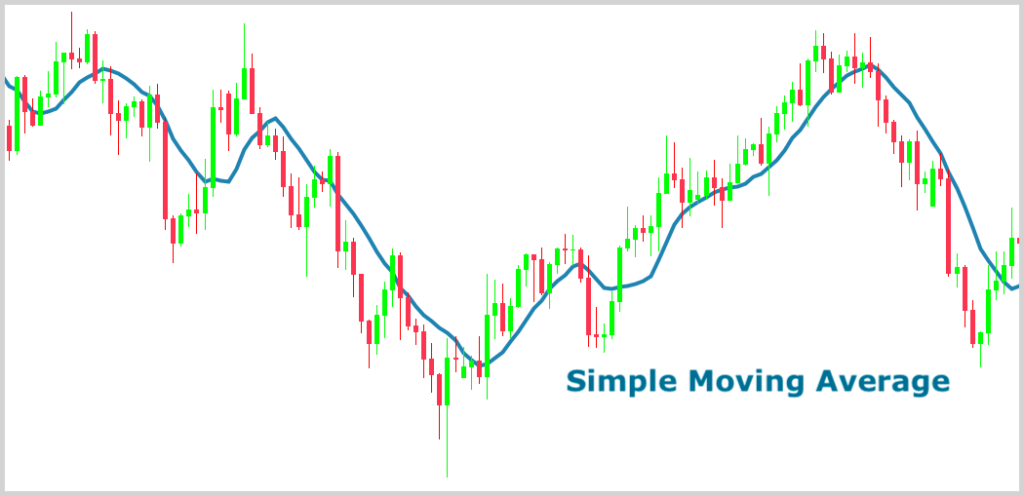
Just think about the simple moving average (SMA).
Of course, it’s an unlikely scenario, but for the sake of simplicity, let’s say we have the following daily high prices for EUR/USD:
1.10, 1.20, 1.30, 1.40, 1.50, 1.60.
A five-day SMA based on the highs would be calculated easily by adding the last five daily high prices and dividing the sum by five (the total number of periods).
(1.20 + 1.30 + 1.40 + 1.50 + 1.60) / 5 = 1.4
The term “moving” comes from the fact that when new data is added into the calculation (in this case, when a day has passed), the average is recalculated by adding the new data and dropping the last.
An exponential moving average is similar to the SMA; the difference is that it places greater weight on the most recent prices and therefore reacts faster than the slower-moving SMA.
We won’t go into the calculation of the EMA, because it’s more difficult, and this article is about the MACD.
What you need to know is, just like many short-term traders, the MACD indicator formula also uses exponential moving averages.
Here’s a picture from the indicator box again, but this time, the names of the visible components are labeled:
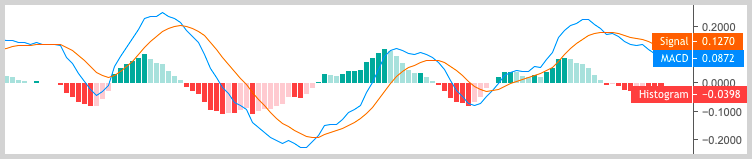
Typically, when traders talk about the formula for MACD, they think about the formula for the MACD line:

As you can see, it’s the difference between a 12-period EMA and a 26-period EMA. You may notice that the two EMAs aren’t featured on the indicator; instead, they are given as parameters when you apply the MACD to your chart.
The MACD line fluctuates above and below a zero level as the invisible EMAs converge, cross and diverge.
The other line that is shown beside the MACD line is the signal line.
It is simply a 9-period EMA built on the value of the MACD line. For obvious reasons, the signal line will always be slower, thus, the MACD line will occasionally cross over it. We’ll talk about crossover signals a little below.
The indicator is often displayed with a histogram, which represents the distance between the MACD and its signal line. When a crossover occurs, the histogram temporarily disappears, as there’s no difference between the lines at the time of the cross.

It’s visually attractive, but you can get the same information by looking at the lines.
How to Trade Crossovers with MACD
Crossover signals are the primary trading signals of the MACD indicator.
Basically, there are two ways a crossover can take place:
1. Signal line crossover
2. Zero level crossover
Signal Line Crossovers
At any given point, the current price reflects the consensus of value among all the market participants. Consequently, a moving average represents an average consensus of value.
From this analogy, we can also say that a short-term moving average symbolizes the short-term market consensus, while a long-term moving average shows us the long-term consensus.
Makes sense, right?
When the prevailing trend starts to reverse, the faster MACD line will react first and eventually cross the signal line, showing us the other party is starting to dominate the market.
That is also when the histogram changes its sign.
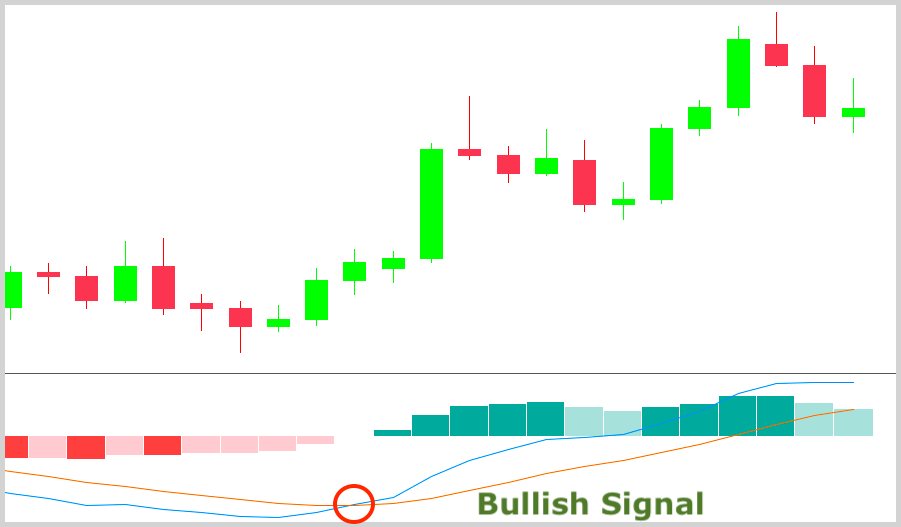
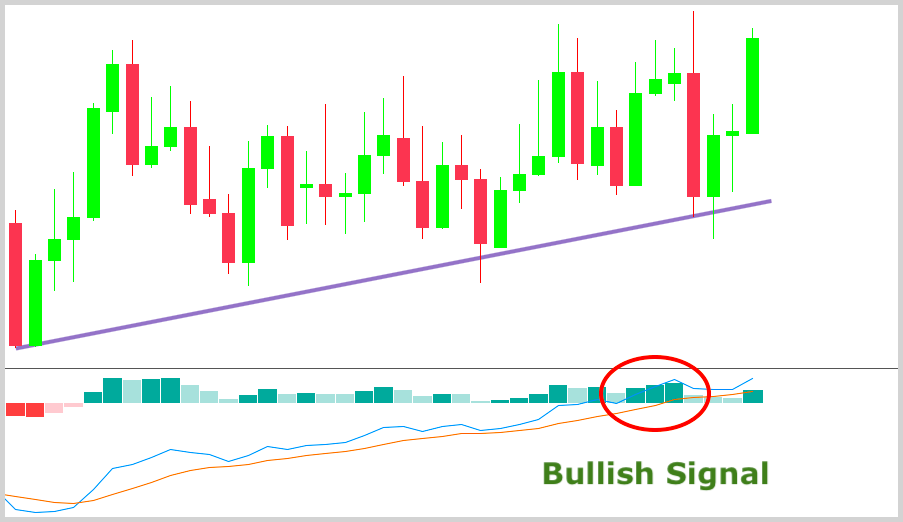
When the MACD rises above its signal line, it’s a bullish signal, which indicates it is better to trade from the buy side.
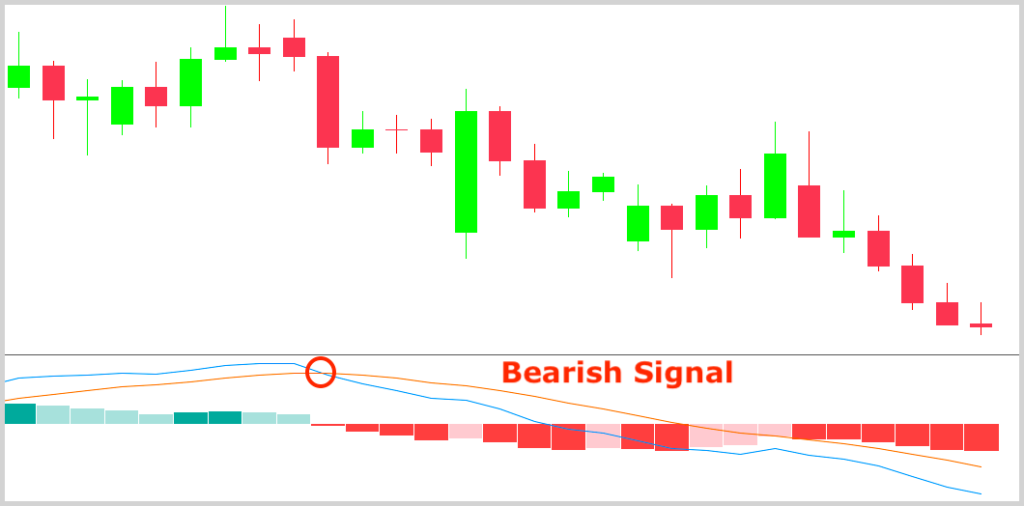
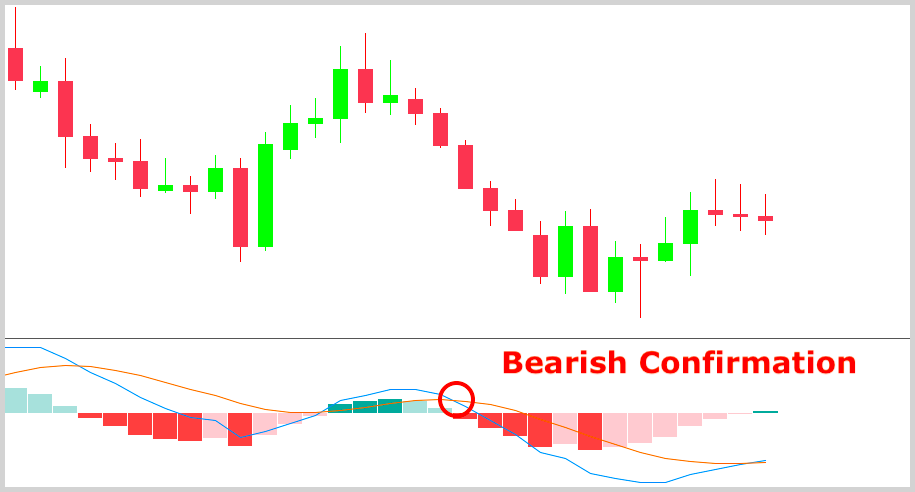
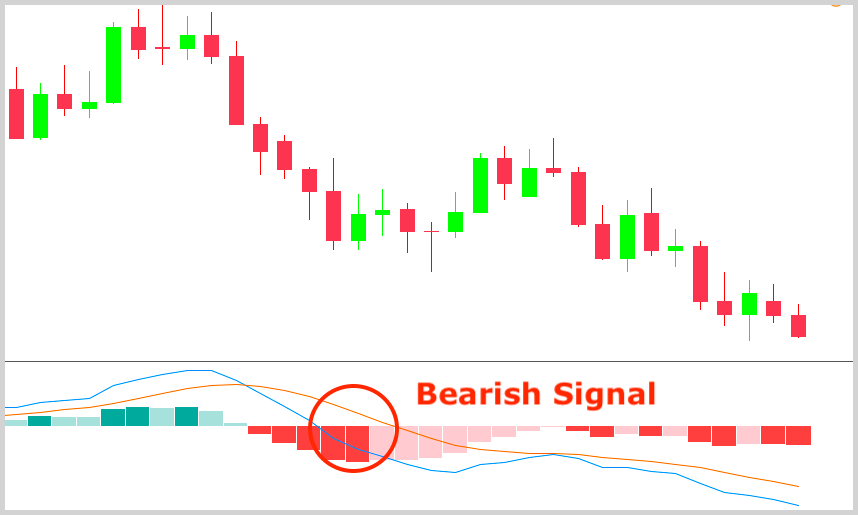
Conversely, when the MACD falls below its signal line, it’s a bearish signal, which indicates it may be time to be a seller.
Please keep in mind that just because the short-term market sentiment is shifting, it doesn’t always mean the reversal of the trend. In fact, if you see a crossover conforming to the prevailing trend, you can take that as a confirmation regarding the health of that trend.
For instance, if the MACD crosses below its signal line following a small correction within a longer-term downtrend, it’s likely that the downtrend will continue.
Zero Level Crossovers
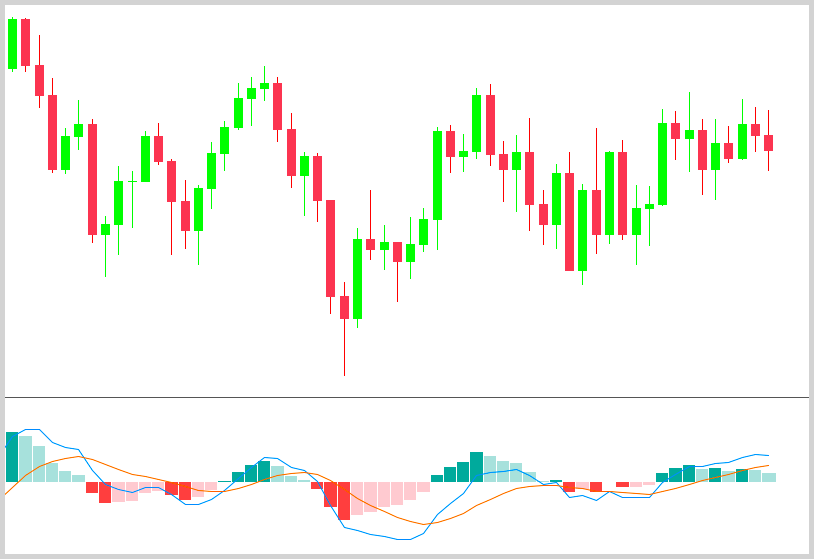
Zero level crossovers are produced when the MACD and signal lines simultaneously cross above or below the horizontal zero axis.
A change from positive to negative is interpreted as a bearish signal:
The MACD will remain positive or negative as long as there is a sustained trend.
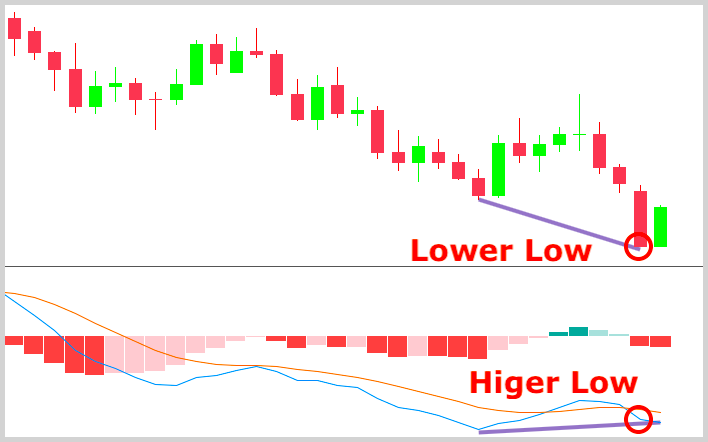
How to Trade Divergences with MACD
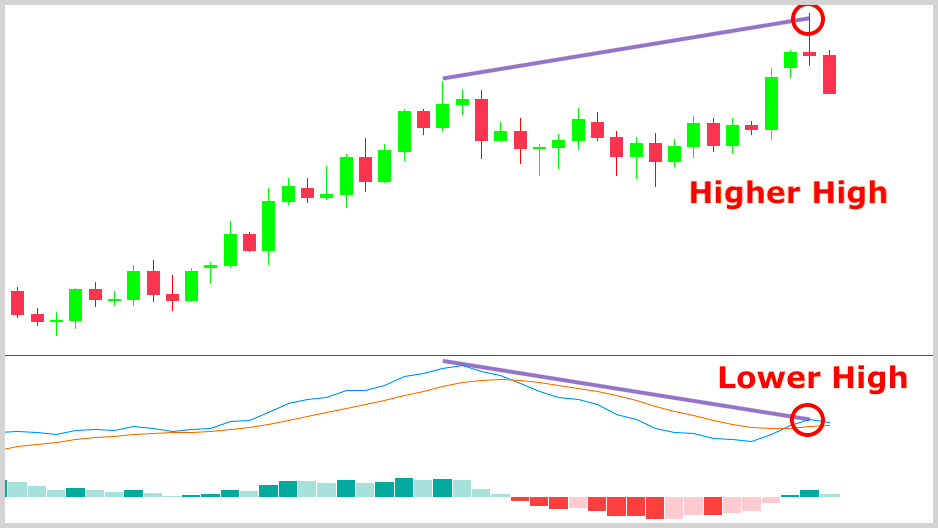
Divergence occurs when price separates from the MACD and they begin going in opposite directions.
We can talk about bearish (negative) and bullish (positive) divergence.
Bearish divergence happens when the price is trending up but the MACD heads downward. It’s a sign that the strength of the prevailing price movement is decreasing and the uptrend may have reached its peak.
Using divergences can be an excellent way to make trading decisions, but as always, you should look for other confirmations. For example, you may decide to use candlestick patterns.
Different MACD Indicator Settings
Once you select the MACD from the indicator menu, the values of 12, 26 and 9 are given as the default parameter setting. In most cases, you’ll be okay with that. However, it can also happen that you want to experiment a bit.

Depending on your needs, you can come up with different parameters.
For example, if you’re a day trader, you may want to increase the responsiveness of the indicator in order to make it more suitable for short-term trading. In that case, a MACD setting of 3-10-16 or 5-34-1 can work.
On the flip side, if you want to monitor longer-term trends, you can try settings like 24, 52, 18 or bigger.
Keep in mind that just like it’s true for all the other indicators, the effectiveness of the MACD depends on how you incorporate it into your trading strategy.

Believe us: no matter what settings you choose, there will always be false signals. Unless you don’t have a compelling reason, it’s better to stick with the default settings and avoid looking for the best set-up, which simply doesn’t exist.
How to Use the MACD in Your Trading Strategy
It’s essential to remember the MACD indicator is an average of other averages. In other words, it’s built on a lot of old data and will always trail significantly behind the current price action.
(If you read our definitive guide on technical indicators, you know that all indicators are lagging to some degree.)
Now, this doesn’t mean it would be wrong.
Indicators that are based on some sort of price averaging might be less useful at finding entry points, but at the same time, they can be very helpful in validating trends.
With that said, in most cases, you don’t want to use the MACD as a standalone indicator but as a complementary tool whose signals can make it easy for you to be on the right side of the market.
Let’s take an example.
We’re going to rely on the concept of multiple timeframe analysis. For those who have never heard about this, it’s a simple theory that involves analyzing not just one but typically three related timeframes.
These are referred to as long-term, medium-term and short-term. For Instance, H1, H4, D1 or M1, M5, M30 could work.
The idea is simple.
Different timeframes usually have different trends. It doesn’t make sense to analyze all the timeframes, but as long as it’s relevant, it would be a mistake to ignore the bigger picture.
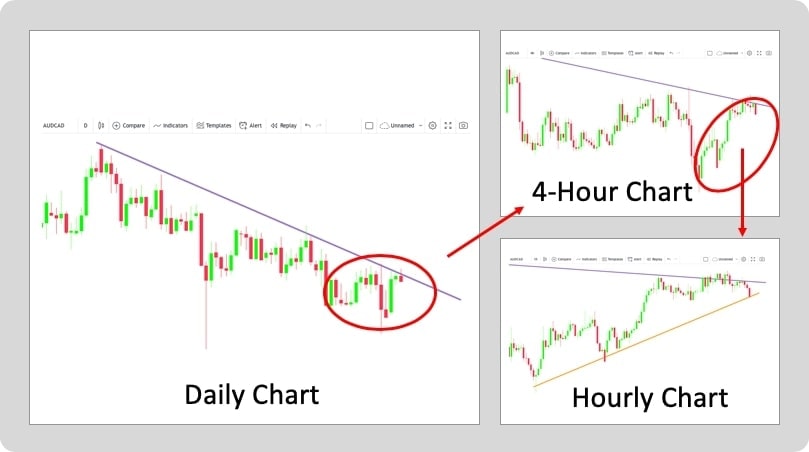
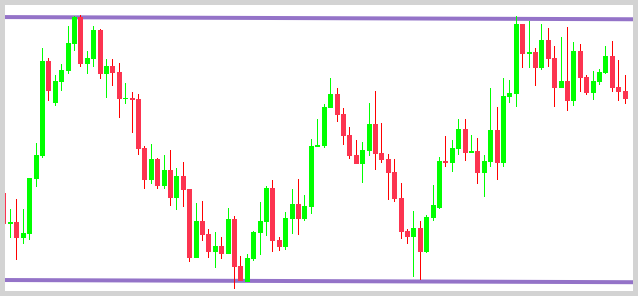
The long-term TF is used to determine the strongest support and resistance zones and the overall trend. You may want to apply the MACD to this chart.
The medium-term TF is good to locate smaller moves within the broader trend and medium-term support and resistance zones. It’s also possible to apply the indicator to this chart.Either way, you can look for set-ups on the short-term TF in the direction of the long-term trend. By doing that, you will find amazing risk to reward ratios and higher probability trades.
How Reliable Is Using the MACD?
It may sound like a simple question, but it’s nearly impossible to give an accurate answer. In general, since the indicator is designed for long-term trading, it works best when applied to daily, weekly or monthly charts.
As we’re talking about a trend-following indicator, you should not rely on its signals during ranges and situations when there’s no trend. Most false signals are produced when prices swing massively up and down without going into a clear direction.
Please note that since no indicator can predict the future with certainty, you will always incur losing trades when using the MACD. By using multiple tools simultaneously, you can tilt the odds in your favor and make money in the long run.
General FAQ
MACD is a popular forex indicator that you can use to trade trends. The term is an acronym for moving average convergence/divergence.
It is made up of different time-scaled moving averages. The different averages generate the trading signals as they converge, cross and diverge.
If you’re a day trader, you may want to increase the responsiveness of the indicator in order to make it more suitable for short-term trading. In that case, a MACD setting of 3-10-16 or 5-34-1 can work.
The MACD is a great indicator, but it’s built on a lot of old data and will always trail behind the current price action. It is more helpful in validating trends rather than finding entry points.