Tweezer tops and tweezer bottoms are candlestick patterns.
While technical indicators make trading easier for many people, they certainly have their limitations.
One of them is lagginess. That is, while there are more responsive technical indicators, they always lag behind price action to some extent.
Because trading is so competitive, it’s only reasonable to want to avoid delays as much as possible and see early if the market trend is shifting.
That’s where tweezers can help.
As candlestick patterns, they give you a real-time reading of the market.
With tweezers, you longer have to wait for an indicator to tell you if there is something unfolding. You will know it.
There is only one problem.
If you’re anything like most traders, you likely don’t know much about what tweezer tops and tweezer bottoms are, let alone how to trade them.
Don’t worry, we’ll solve that in this article and explain all you need to know about these patterns.
We’ll also provide you with lots of examples to look at, so you can examine different setups and practice spotting tweezers.
What is a tweezer top and a tweezer bottom?
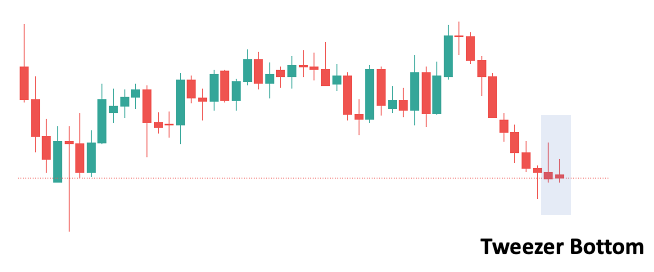
Tweezers are two candlesticks with matching highs or lows.
They are referred to as tweezer tops and tweezer bottoms because they resemble the two prongs of a pair of tweezers.
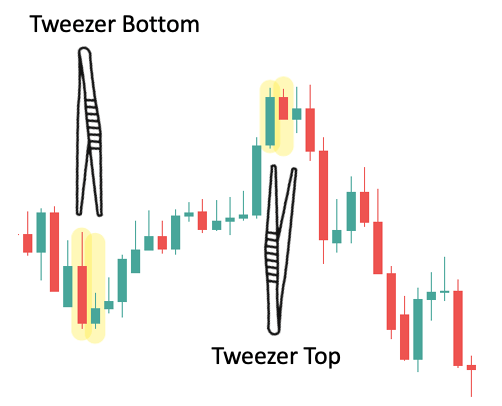
Ideally the tweezers should have a candle with a long body first, with a smaller-bodied candle thereafter.
You can see this in the picture above.
The idea is that whatever strong effect the market had on the first candle is dissipating with the subsequent small candle, implying that a reversal could be on the way.
Of course, you shouldn’t rush to short uptrends and buy dips every time there is a tweezer top or bottom.
Simple principles can be powerful in forex, but they must be used in the right context, and tweezers are no exception.
(It also helps if you have a trading plan with risk management and all that other great stuff, but we’re not going to delve into that here; there are plenty of guides on the blog that cover these topics.)
In the next two sections, we will take a closer look at tweezer tops and tweezer bottoms one at a time.
Then we’ll discuss how to place them in the right context, filter out bad signals, and open high-probability trades.
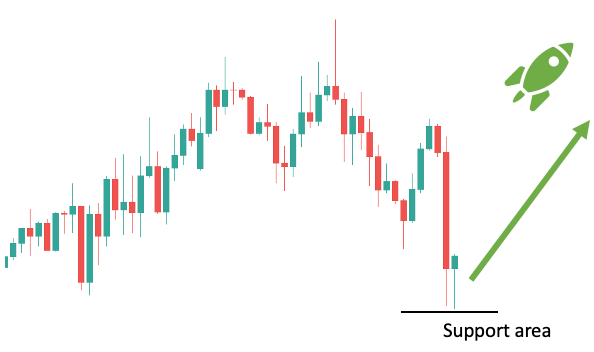
What does a tweezer bottom indicate?
The tweezer bottom indicates that the market may have hit a level of support from which it can begin to rise.
That said, touching a low point two times in a row is not enough of a clue by itself to jump on a trade against the trend.
So, if you want to trade tweezer bottoms successfully, you need to be able to filter out signals that show it is worth it to trade.
You also need to be clear with your expectations.
Chart patterns like the double bottom often foreshadow large reversals, where daily or even yearly trends turn around.
This is because these patterns consist of many candlesticks and take a long time to form, leaving a discernible pattern of shift in market sentiment.
Candlestick patterns, on the other hand, are not particularly complicated. The tweezer bottom may be a solid trading pattern, but it is merely two candlesticks on the chart with the same low.
You can’t really compare a signal like that to a pattern with hundreds of candles that has been developing for weeks.
Even if there is a strong tweezer bottom (which we will show you how to spot in a moment), it is probably best to take it as a signal for a trend retracement rather than for a complete reversal.
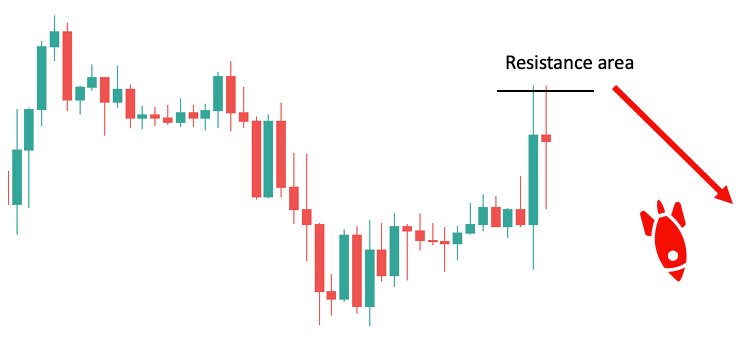
What does a tweezer top indicate?
The tweezer top indicates that the market may have hit a level of resistance from which it can begin to rise.
The situation is very similar to the tweezer bottom we mentioned above, and everything we said applies here as well.
You must be careful expecting large trend reversals with tweezer tops since most will only be followed by a moderate consolidation.
In uptrends, buyers will usually look out for these dips and jump on them to add to their positions. So, if you started selling into every tweezer top you saw in an uptrend, you could easily burn yourself.
How to find the best tweezer tops and tweezer bottoms
Okay, so now you know that tweezers are no silver bullet.
But guess what?
There are a few simple things that can make tweezer tops and bottoms much more reliable trading signals.
That’s what we’re going to talk about now.
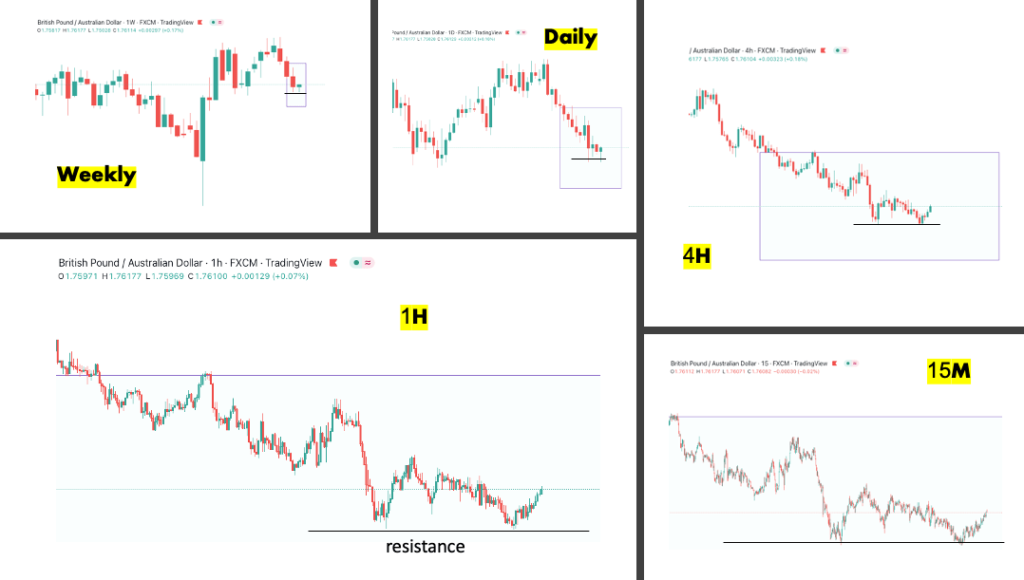
The first thing is to differentiate between tweezers that form on daily, weekly, and monthly charts, and tweezers that are intraday.
Tweezers on long-term charts are the most important because they mark powerful price levels that often become the base for a sustained rally or drop.

Let’s take the weekly chart as an example.
If two weekly sessions (two candlesticks on the weekly chart) have the same low, it indicates that the market has been fighting to break through that level for quite a long time.
Although there are just two candlesticks on the weekly chart, if you zoom in, there are 10 daily candles, 60 4-hour candles, 240 1-hour candles, and so on.
Many of these candles linger around the same level and the market has most likely led an attack or two on the extreme price during the two-week period, making it a potent support/resistance level.
With intraday tweezers, the situation is different.
Two 1-hour candles touching the same high/low can easily be a random coincidence rather than the sign of a significant shift in market dynamics.
We’re not saying that all high-timeframe tweezers are winners and all low-timeframe tweezers are whack signals. Far from that.
But, in general, for intraday tweezers it takes a special combination of candlesticks to become important while long-term tweezers have the privilege of being around longer and thus having a higher chance to better reflect the market sentiment.
If you want to trade intraday tweezer tops and bottoms, look out for patterns where the second candle is a reversal candlestick.
In the following section, we’re going to take a look at two different trade set-ups where you will see examples of what that looks like in action.
How to trade tweezer tops and tweezer bottoms
There are many ways to trade tweezers, but you probably want to trade them in a way that provides you the highest chance of winning.
In this scenario, you will undoubtedly benefit from seeing the examples below, which will walk you through two high-probability trades, detailing all the key steps from planning to implementation.
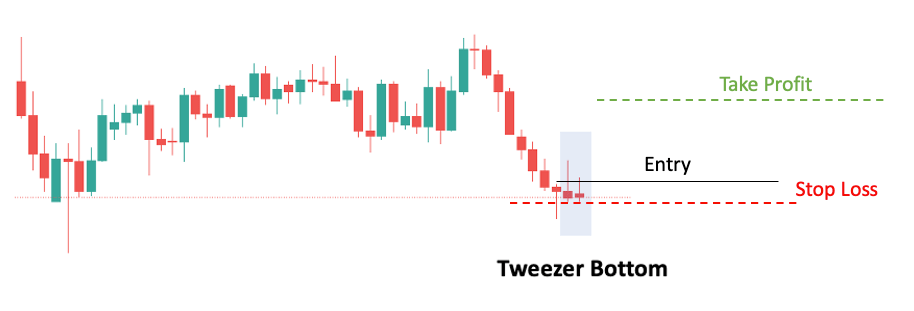
First, we’re going to look at a tweezer bottom, so let’s consider the following tweezer bottom set-up:
We took this screenshot from the daily AUD/JPY chart.
There are two reasons we are interested in trading this pattern. First, you can see that the market has been going down for 10 candles in a row.
That means 10 consecutive days where prices have fallen.
When the market is so overextended in one direction, a correction or some movement in the opposite direction is almost certain to come.
This is because shorts (people that sold the currency pair) can close their positions and realize their gains by buying back.
When you combine this with the potential that some people have positive views and will want to take advantage of the cheaper price, you can understand why a rebound is likely.
Even if it is only temporary, we can trade this movement and profit.
The second reason is that you can clearly see how sellers are already losing momentum.
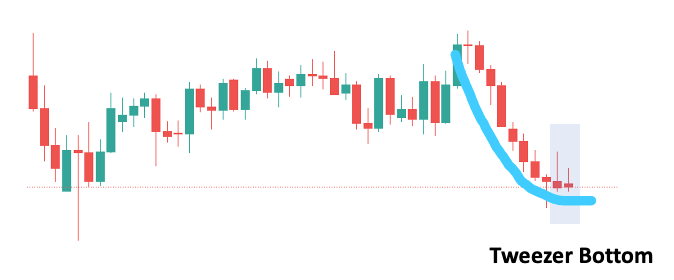
The first few candles were large bearish candles, but then we saw smaller and smaller candles, which eventually began converging around the same area, indicating a likely market bottom.
The tweezer bottom is the hallmark of this and it is our catalyst to enter into a long trade.
So, at this point, we can zoom in on the chart a little more. Let’s take a look at the 15-minute chart and try to come up with a trade idea that will allow us to join this trade with a tight stop loss.
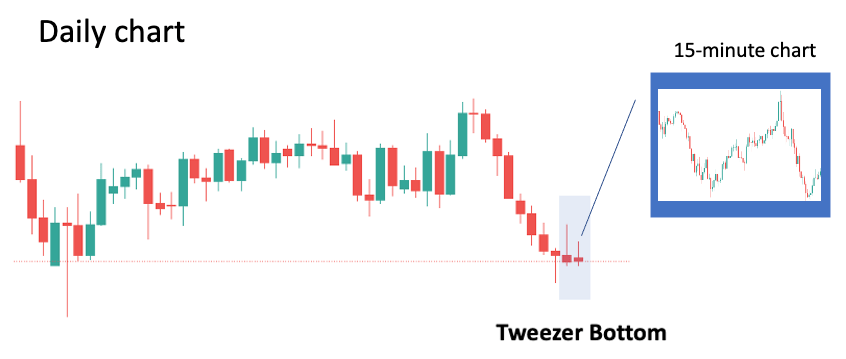
This will help us to magnify the return we can get out of trading the rebound.
Below you can see a possible set-up:
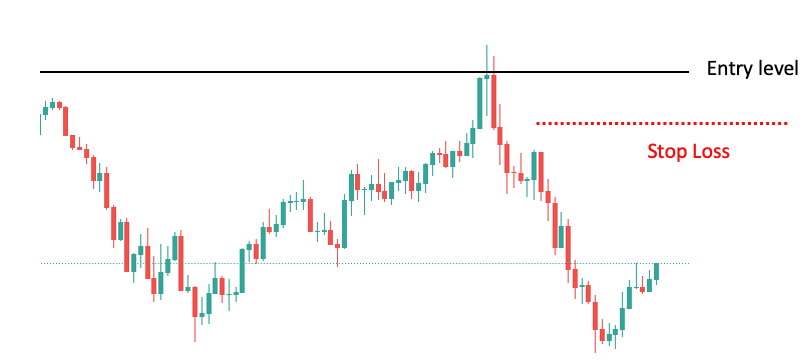
We plan to enter when the price reaches the nearest resistance level and breaks out of it. This resistance, by the way, is around the high of the second candle in the tweezer bottom.
So, if our entry criteria is fulfilled we open a long trade.
You can see that the stop loss is really close. The take profit, however, is far. So far, in fact, that it is not even included on this screenshot simply because it would not fit into the picture.
The TP is positioned far because it is set on the daily chart, whilst the SL is set on the 15-minute chart.
Setting your stop loss on a lower timeframe and your profit objective on a higher timeframe is a common strategy that will help you maintain good risk-reward trades.
So, there you go.
This is an example of what a great trade looks like using the tweezer bottom. And of course, you can reverse this explanation for the tweezer top.
It is also not necessary that you incorporate multiple timeframe analyses into your system. You can simply look for tweezers and set your stop loss and take profit on the same timeframe.
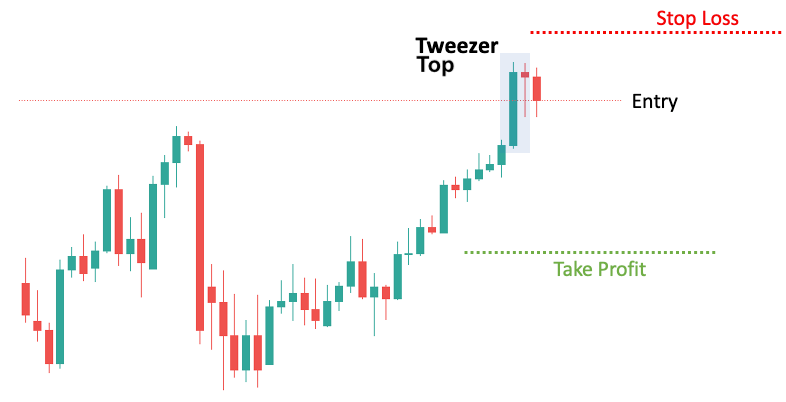
Here’s an example, this time with a tweezer top:
This content belongs to ForexSpringBoard.com. Do NOT Copy!
Note that the second candle in the formation is a top reversal candlestick.
It is a hanging man, which forms when the upside momentum slows down.
When the tweezer top has a hanging man as its second candlestick, you have a strengthened signal: two matching tops and another reversal pattern.
If the next candle closes under the hanging man body, odds are strong that a top has been reached.
That’s why we placed our entry at the close of the very next candlestick after the hanging man.
So, if you want to trade the best tweezer top, look out for a pattern like this where the second candle of the pattern is a hanging man and the third candle closes below the hanging man’s body.
We set the stop loss above the tweezer because if the market reaches this point, then the trade idea is wrong and we want to take the loss and move on.
As for the take profit, we simply calculated which price would earn us twice the risked amount and set it at this level.
FAQ
Tweezers are two candlesticks with matching highs or lows. They are referred to as tweezer tops and tweezer bottoms because they resemble the two prongs of a pair of tweezers.
The tweezer bottom indicates that the market may have hit a level of support from which it can begin to rise.
The tweezer top indicates that the market may have hit a level of resistance from which it can begin to rise.
A possible strategy is to look for tweezers on daily or weekly charts. You can zoom in on the chart and enter using a low timeframe. Set your SL on the low timeframe and your TP on the high timeframe.
Conclusion
In this guide we discussed what tweezer tops and tweezer bottoms are in forex.
You not only learned how to spot these candlestick patterns, but we also went over two trading possibilities employing tweezers.
The key to remember is that tweezers are most reliable on daily and weekly charts. For intraday tweezers, look out for patterns where the second candle is a reversal candlestick.
At the end of the day, whether or not you utilize tweezers in your trading is entirely up to you.
Feel free to look around our blog, learn about various topics, and develop a trading plan that works for you.