Multiple timeframe analysis is extremely popular.
But what does it mean and how can you use it in your trading?
The simple goal of multiple timeframe analysis is to find out what the market is doing at different time horizons and use it to your advantage to find better entry and exit points.
This post will cover everything you need to know about the topic. We’ll start by discussing the concept in more detail. Then we’ll take a look at an example day trading strategy.
What Is Multiple Timeframe Analysis?
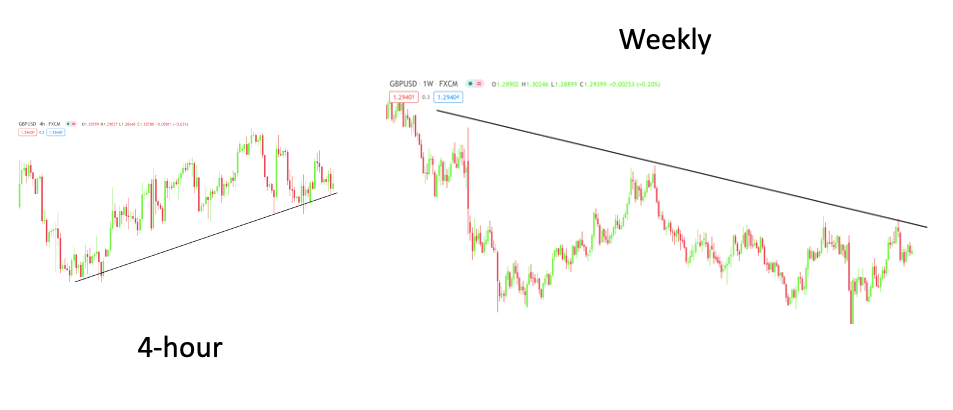
You’ve probably already recognized that different time frames often have different trends.
For example, you can see that this currency pair is going up on the 4-hour chart, but when you switch over to weekly, it’s going down.
In MetaTrader alone, there are 9 pre-defined timeframes. Other trading platforms might even allow you to create customs TFs. All of these can potentially show you a different trend.
So, the question arises: What can you do to avoid going nuts over conflicting signals?
On the one hand, you can decide to focus on one TF and avoid the others. This has the benefit of simplicity and can certainly work in many cases.
However, the drawback of locking yourself into one TF is that you can easily lose sight of the big picture.
Let’s imagine that you’re a trend trader, for example. You might buy into something that appears to be a nice uptrend on the hourly chart, but in reality, it might be a correction move that is about to end on the daily.
To avoid going against the overall trend, many traders try to align with the larger moves despite trading lower charts. This is where the concept of multiple timeframe analysis enters the scene.
How to Do Multiple Timeframe Analysis
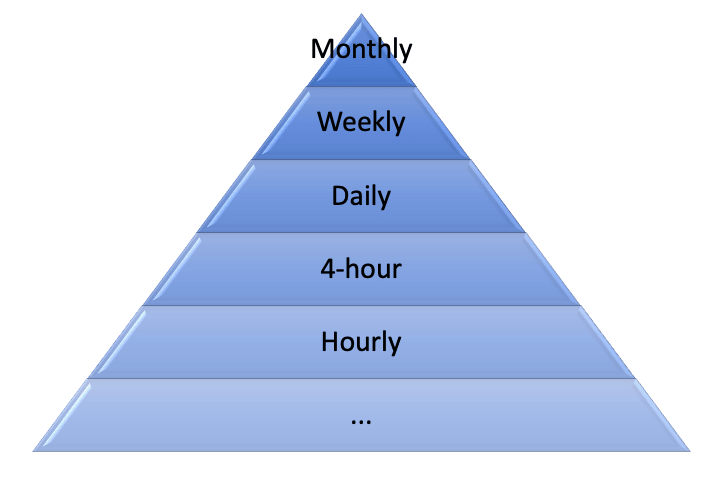
Typically, multiple timeframe analysis involves using three different timeframes:
- Long-term
- Medium-term
- Short-term
The purpose of the long-term timeframe is to determine the overall trend and the strongest support and resistance zones.
This TF is typically two times higher than the TF on which you would execute your trades.
Then comes the medium-term timeframe, in which smaller moves within the broader trend and medium-term support and resistance zones are identified. This is usually located right above your traded TF.

Finally, the short-term timeframe is where trades are executed considering the previously identified levels and market conditions.
You can see that the concept is quite simple. You still trade the timeframe you would normally trade, but the analysis is supplemented with information from relevant higher-level charts.
The word “relevant” is important and that’s what we are going to get into next.
What Are the Best Timeframe Combinations for Multiple Timeframe Analysis?
When it comes to multiple timeframe analysis, you want to use time horizons that are relevant to each other.
Now, of course, you can argue that every TF is relevant to each other, as they represent the same thing and you’re completely right. We’re talking about relevance from a trading point of view.

For example, if you trade the 5 minutes chart, is what is happening on the daily chart really that important?
Chances are, the trend on the hourly or 15 minutes chart provides enough opportunities. They might go against the daily chart, but even a small daily correction can provide a trend that lasts for a long time on smaller charts, and you, as an intraday trader, can take advantage of this.
Below you’ll find a few possible timeframe combinations for different trading styles:
- Position Trading MN, W1, D1
- Swing Trading W1, D1, H4
- Swing Trading D1, H4, H1
- Day Trading H4, H1, M15
- Day Trading H1, M15, M5
- Scalping M15, M5, M1
Avoid Confirmation Biases
According to SimplyPsychology:
“Confirmation bias is the tendency of people to favor information that confirms their existing beliefs or hypotheses.”
In the context of trading, it occurs when you decide which way you want to trade and try to analyze the charts in a way that confirms your existing belief.
A typical example would be when you try to bend your analysis on the medium- and long-term charts to support the trade idea that’s unfolding on your traded chart.
Unfortunately, it’s probably not going to benefit you in the long run, not to mention that it completely eliminates the purpose of doing multiple timeframe analysis.
This mistake is easily avoidable if you start your analysis with a broader view and then work your way down.
In other words, you start with the long-term timeframe and finish with your traded timeframe and not the other way around.
Multiple Timeframe Analysis for Day Trading – Example Strategy
It’s probably safe to say that one of the most common forms of multiple time frame analysis is to use daily charts to identify the overall trend and then use the hourly charts to find trade opportunities.
That’s what we’re going to do in this strategy, but we will also consider the 4-hour charts.
This is a strategy we randomly came up with to help you understand how you can incorporate multiple timeframe analysis into a day trading strategy. In other words, don’t trade this strategy with real money.
In any case, if you want to try something new, do some backtesting first. If you don’t know how to do backtesting, read our guide here.
Here’s the strategy in a nutshell:
Used Timeframes
- Long-term: D1
- Medium-term: H4
- Short-term: H1
Analysis Outline
- Look for the currency pair to be trading above or below the 100-period Simple Moving Average (SMA) on the daily chart.
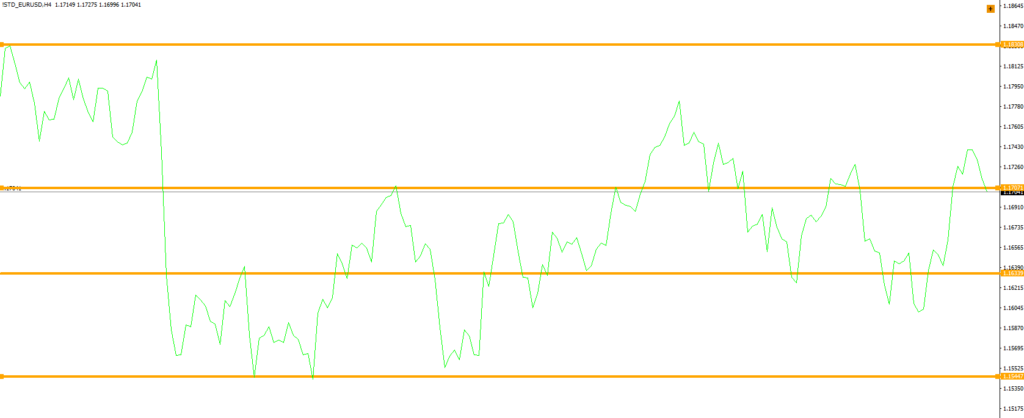
- Identify support and resistance levels on the H4 chart.
- Look for trading signals on the H1 chart.
Long Trade
- The price is above the 100-period SMA on the daily chart.
- A Bullish Kangaroo Tail appears on a support level.
- Stop Loss: Slightly below the support zone.
- Take Profit: Next resistance zone
Short Trade

- The price is below the 100-period SMA on the daily chart.
- A Bearish Kangaroo Tail appears on a resistance level.
- Stop Loss: Above the resistance level.
- Take Profit: Next support zone.
Example Trades
We begin by checking whether the price is above or below the SMA on the daily chart.

Because it’s below, we’re going to look for short trades on the hourly chart. However, first we go to the 4-hour chart and identity relevant support and resistance zones.
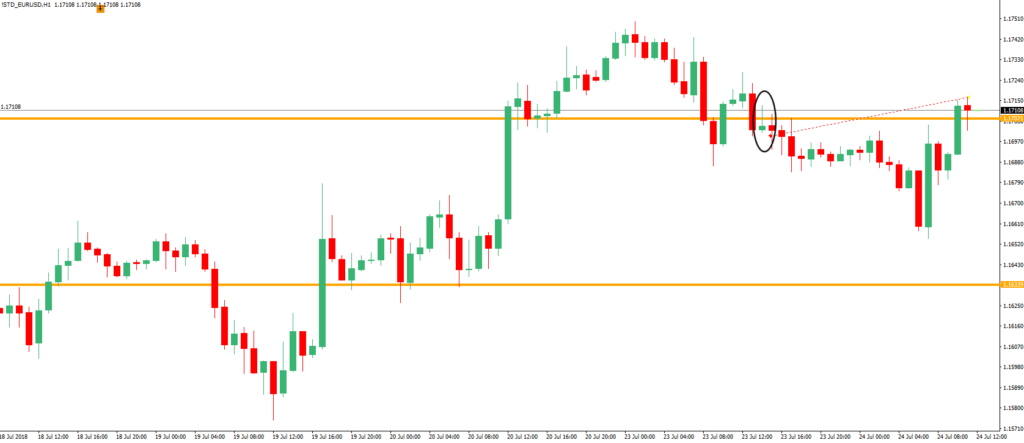
We use these areas to look for kangaroo tails on the hourly chart. Because we’re in a downtrend, we’re going to look for bearish kangaroo tails.
Bearish kangaroo tails appear when buyers push the price higher, but they bump into a resistance zone and the price suddenly reverts back, resulting in a “long-tailed” candlestick.
The idea is to enter at a potential turning point, knowing that the trade direction is aligned with the overall trend.
An example of a trade set-up is shown below:
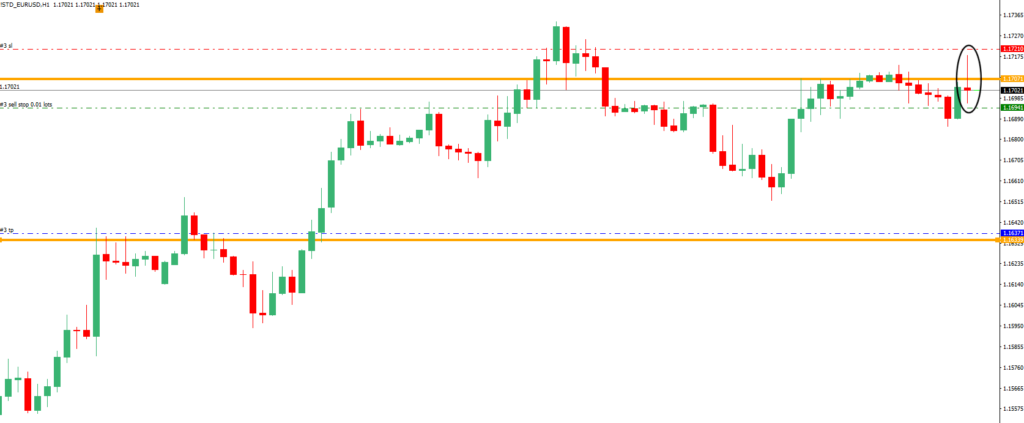
Note that we use a pending order for entry. The reason is that it provides an additional bit of confirmation that the market, indeed, is beginning to move back into trend direction.
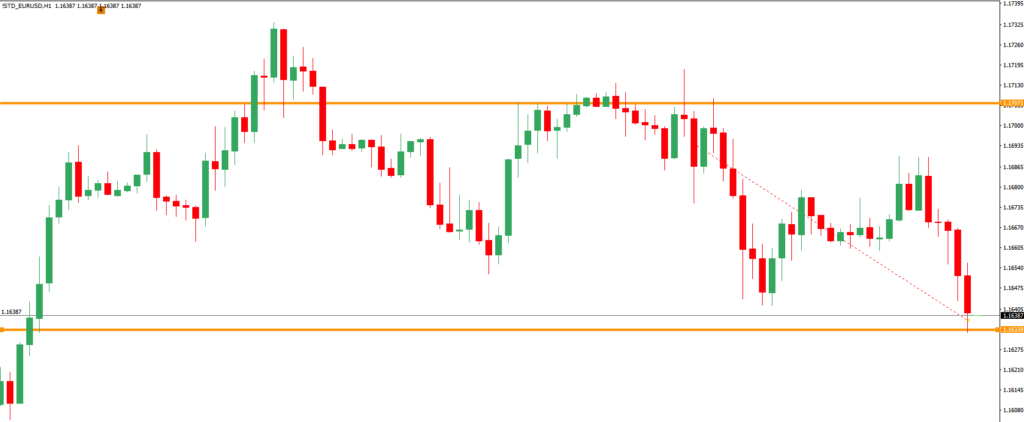
Of course, not all trades will be winners. In fact, with relatively far profit targets and tight stops, we would expect to be stopped out quite often.
For instance, you can see here that after nearly reaching the profit target, a quick bullish pressure resulted in a stop-out and the trade ended up producing a loss.
Whether or not the occasional winners make this strategy profitable is a matter of backtesting. The point was to put things into perspective by showing you a way to apply the theory in your trading.
Conclusion
So, there you have it.
You’ve learned how multiple timeframe analysis works in less time than it takes to eat breakfast in the morning.
Whenever you trade, your chart will have ups and downs. The most important thing to be aware of is that you should be “swimming with the big fish”.
While the idea is solid, putting it into practice and making money is much harder than it sounds.
If you were thinking about incorporating multiple timeframes into your strategy, you must do some backtesting.
Try different methods and experiment until you find a combination of techniques that works for you.