
Institutional candles are a hot topic in forex.
People talk about them on YouTube, in forums, and in places like Telegram.
So it’s only natural that you are curious about what they are.
In this blog post, we’ll teach you everything you need to know about institutional candles in forex.
This post was created with beginners in mind so we will keep things simple (though we will also share some cool insights so don’t shy away if you are more experienced).
Without further ado, let’s get started.
What are institutional candles in forex?
Institutional candles are candles located at the bottom of a downward move or the top of an upward move.
They break an important price level (support or resistance); after they close, the market reverses and begins to move in the opposite direction.
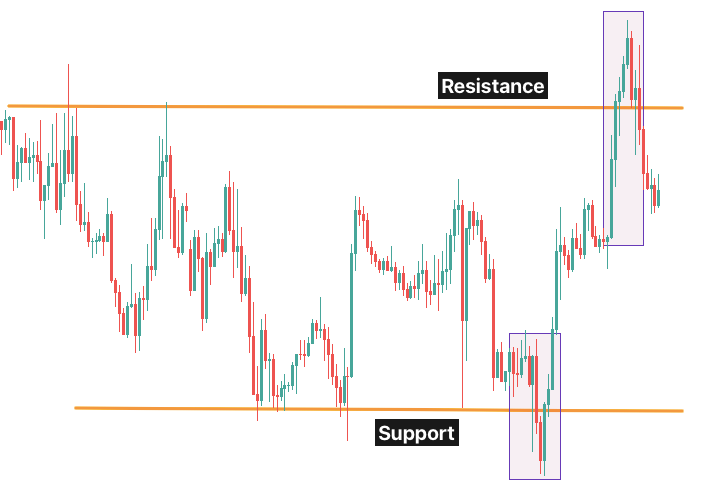
(Support and resistance are covered in more detail in a separate guidewhich you can read here.)
The topic of institutional candles belongs to a popular set of trading techniques called smart money concepts (SMC trading).
If you haven’t already, we recommend that youread our guide on SMC trading, as we address some misconceptions you definitely want to know about.
SMC traders state that institutional candles are special candlesticks that form when institutions manipulate the price to their advantage.
The theory goes something like this:
The institution wants to open a large buy or sell order and needs counter parties to execute the transaction.
It sees a support or resistance level on the chart and (reasonably) assumes that plenty of stop losses are concentrated just beyond this level.
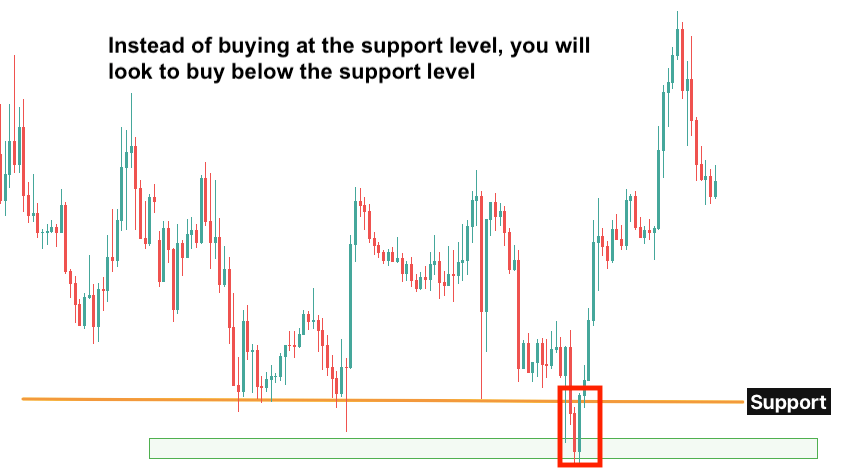
If the institution wants to have a long position (wants to buy and hold), it will first sell to push the price below the support.
This will trigger all the stop losses located below the support level.
Because these stop losses were placed by traders who had bought previously, they are essentially sell orders.
The picture below illustrates:
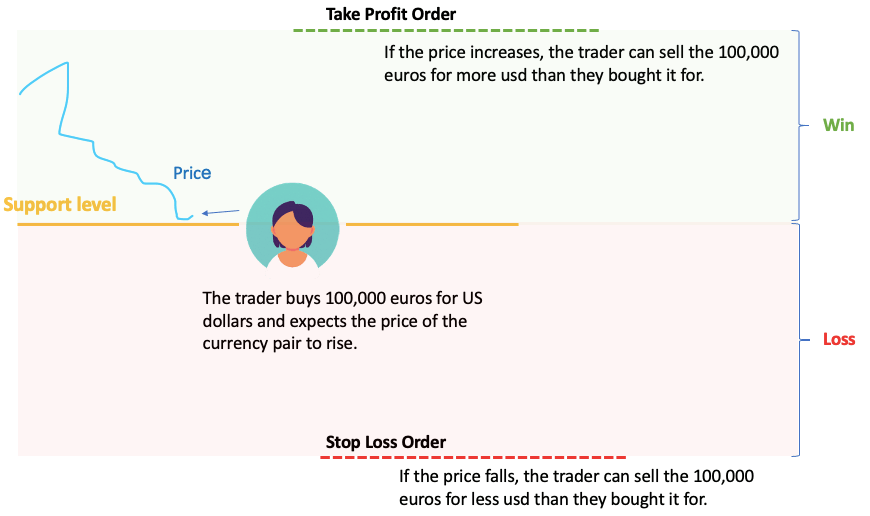
The moment the stops are triggered, the market is flooded with sell orders and nosedives. The institution happily flips its sell position and buys from people at a cheaper price.
Consequently, the market jumps back above support and begins to rise as the sell pressure abates.
Note that the institution might need to sell only a “small amount” to tip the market and trigger the stops.
It can then sit back and watch as the market is driven lower by the sudden supply, allowing it to exit its relatively small short position (at a profit) and take on its much larger long position, which it had planned all along.
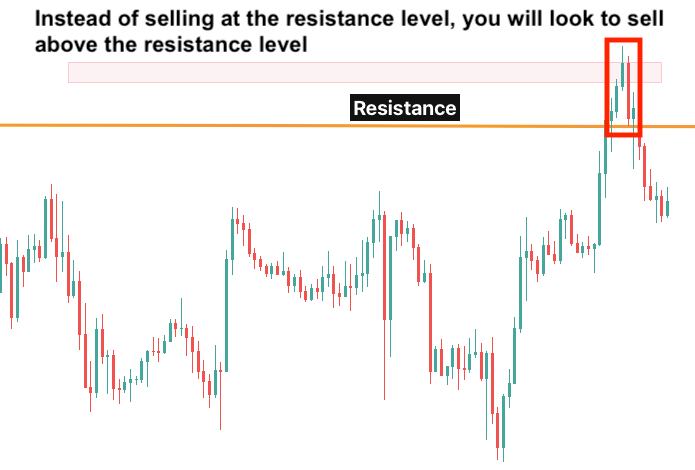
If the institution wants to sell, it will do much of the same thing, just the other way around.
That is, it will push the price above resistance so that it can sell at a high price to everyone whose stop loss was triggered and who is now forced to buy and cover their short position.
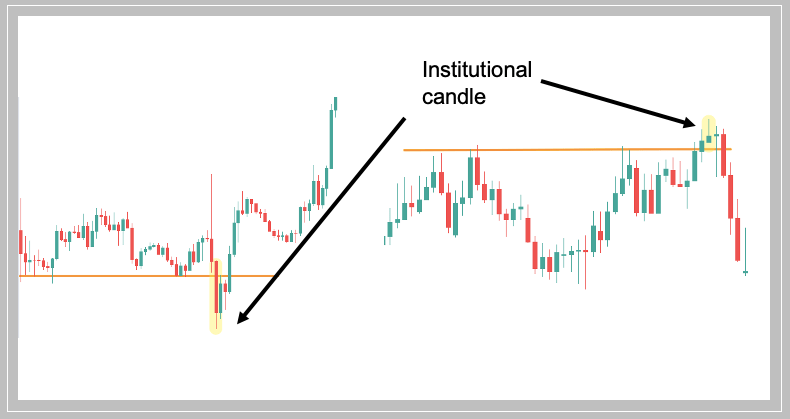
How to spot institutional candles
Another way to look at institutional candles is that they are essentially false breakouts:
The market breaks a support level, then it rises back above it.
The market breaks a resistance level, then it falls back below it.
This makes it easier to think about institutional candles and find them on the chart.
Basically, you are waiting for a move that breaks the S/R level.
Then, if the market swiftly reverses after the breakout, you can pinpoint the institutional candle as the one that is the very last candlestick of the preceding move.
The institutional candles are unlike common candlestick patterns.
They don’t have a characteristic shape. They could have any shape or be any of the manycandlestick patterns out there.
As long as it is the last down candle of a falling move that broke the support or it is the last up candle of a rising move that broke the resistance, you have an institutional candlestick.
Now, this is all nice and dandy, but how do you know when the last candle will occur?
After all, markets don’t always retrace after a breakout. There are plenty of real breakouts followed by rapid run-ups or tumbling prices.
You can fade an upside breakout waiting for an institutional candle only to be burned by the rally that comes afterward and vice versa for a downward breakout.

Unfortunately, there is no way of predicting the “institutional candle” with 100% accuracy, as it would be akin to picking exact turning points.
The fact is, trading institutional candles is not always a winning set-up
There is certainly a benefit to taking the other side of breakouts, as you will look smart when things turn out to your advantage. On the other hand, it can backfire when you miss out on a move that everyone saw coming.
So just like breakout traders often get caught up in false breakouts, traders fading breakouts using institutional candles or any other techniques will have their fair share of losing set-ups as well.
With that, the question arises…
Are institutional candles useful? Should you trade them?
Institutional candles are useful. Here’s why:
They flip the script and make you enter at levels where you would normally place your stop loss.
For most people, this can be a game-changer.
The thing is, if you want to make money, you must get in at good levels.
And what is a good level to get in a buy position? As low as possible. For a short position? As high as possible.
Of course, you have to be reasonable. You can’t just hold off the trade hoping for better prices.
But the price where you would place your stop loss is almost always a really good price, which the market has a reasonable chance of hitting before reversing.
This is in part because institutions might indeed manipulate the price to get some liquidity, although this is less common in the forex market simply because it is already super liquid.
(According to the triennial central bank survey, the daily volume of the forex market surpasses 7.5 trillion dollars.)
The real reason is that markets fluctuate, there is a lot of noise and random moves, and most people don’t give nearly as much breathing room to their trades as they should.
In other words, instead of using wider stops to accommodate price swings, they place their stops close to the entry price, around nearby high/lows, and then wonder why they get stopped out frequently.
Instead of being one of these people, you can put your entry where most people will place their stops.
Most people will buy when the market falls down to support and put their stop loss below support. With an institutional candle set-up, you will buy after the market has dipped below support and get a better price.
Conversely, most people will sell when the market hits resistance and put their stop loss above the resistance. You, instead, will sell only after the price breaks out of the resistance and get a better price for your short.
For your new stops, you can simply use an indicator like the ATR, which will helpmaintain sufficient distance to protect you from market noise.
Note that institutional candles do not solve the problem of having to find a good set-up. For example, if the market is bullish, getting in a short position at a great price won’t do much good for you.
Before trading them, you want to find good set-ups. Below, we give you a cool tip to help you do just that.
Do this to find the best institutional candle forex trades
It’s smart to limit your involvement to situations in which a lot of traders are paying attention and manipulation is more likely.
Let’s look at an example.
In 2022 the dollar went on a major rally, strengthening massively against other currencies.
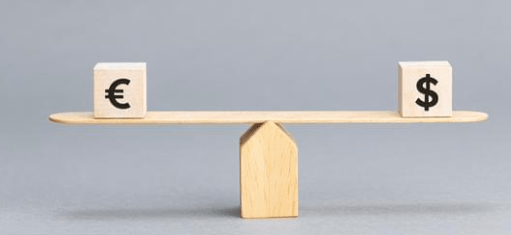
It reached parity with the euro in July, which was a big surprise to many, as for the better part of its existence, some 20 years, the euro had been a significantly stronger currency.
Even a couple of months prior, the exchange rate was hovering around 1.20 and a parity condition seemed to be far-fetched.
So it was no surprise that the 1.0 level was on most people’s radar and was believed to be a key support area for the pair.
Simply put: Many people were planning to buy EUR/USD at this price with a stop underneath.
It appeared unlikely that the dollar would maintain its momentum for much longer, as it was already severely overbought, having gained more than 20% in the previous few months.
Buying the European currency at a deep discount with the dollar prone to a big correction seemed like the perfect opportunity. Many traders were eager to put on a trade as the currency pair was closing in on the parity condition.
The below picture shows what happened thereafter, with the institutional candle circled and magnified.
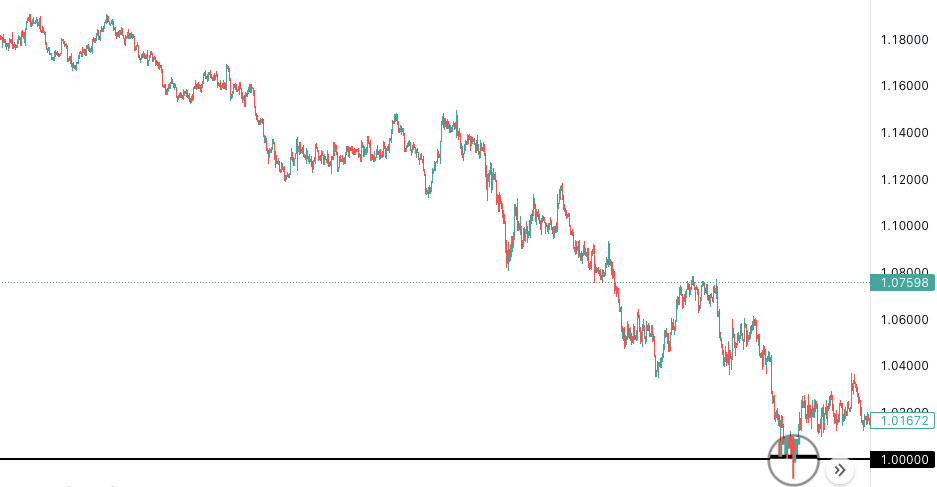
Here’s a more up-close view:
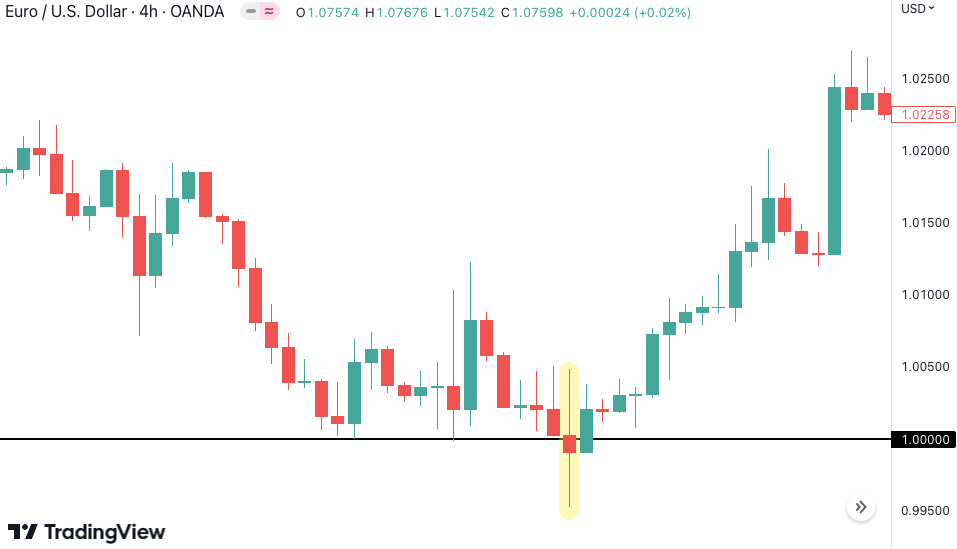
Essentially, most traders were washed out of their position as the market crashed below the support level before rebounding.
Were institutions playing foul to trigger retail stop losses and grab liquidity for themselves?
We will never know for sure, but if they are prone to engaging in this type of behavior, this was a golden opportunity.
It’s important to keep in mind that these situations are rare; in fact, a lot of what you might mistake for market manipulation is simply price wandering at random and stopping you out because your stop was too close, your idea was flawed, or you just had bad luck.
But when a situation like this arises, the institutional candle concept will go a long way toward increasing your odds of a winning trade.
How to trade institutional candles in forex
We touched on the basics of this, but to reiterate the key idea:
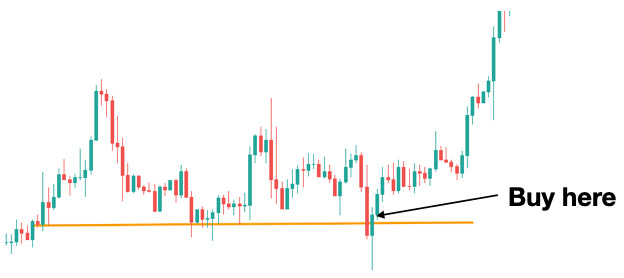
You should buy when the market has broken below support and sell when it has broken above resistance.
How you make this better resemble a real strategy is up to you, but let’s look at a simple example to get you started.
(Illustration only; please don’t trade this with real money.)
You will need two indicators: first, the Relative Strength Index, or RSI, to choose the exact entry point, and then the Average True Range, also known as ATR, to set the stop loss.
The RSI is an oscillator that is used to determine whether the market is normal, overbought, or oversold.You can learn more about it here.
The ATR calculates the extent of market fluctuations and is used to choose a stop loss that is neither too near nor too far from the price.
Armed with these useful indicators, we can construct the following rules for trading institutional candles.
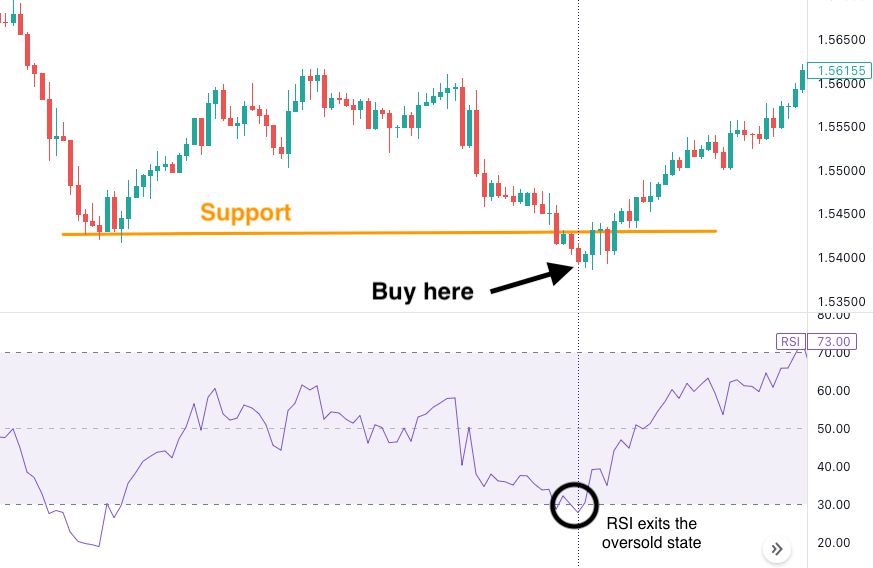
Long trade:
The market breaks below support with a strong bearish candle.
Check the RSI indicator. Wait until it exits oversold territory and begins going up. When this happens, open a long trade.
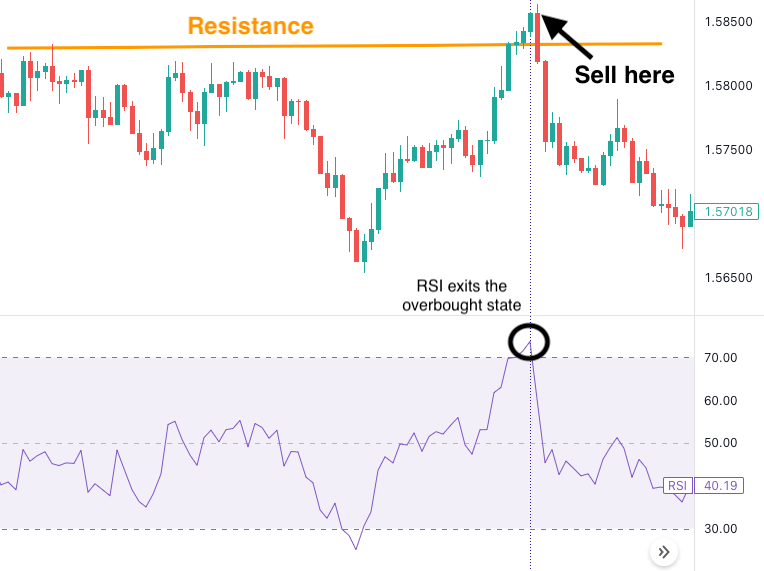
Sell signal:
The market breaks above resistance with a strong bullish candle.
Again, check the RSI indicator. This time, wait until it exits overbought territory and begins to fall. When this happens, open a short trade.
Put your stop loss at twice the ATR indicator’s value on both long and short positions. Place your take profit at three times risk.
For example, if your stop loss is 50 pips away from the entry price, your take profit will be 150 pips away.
Again, this strategy is just a simple example to illustrate a possible way of trading institutional candles in forex.
There are, of course, a lot of other options. Anybody is free to create whatever other strategy they believe could work.
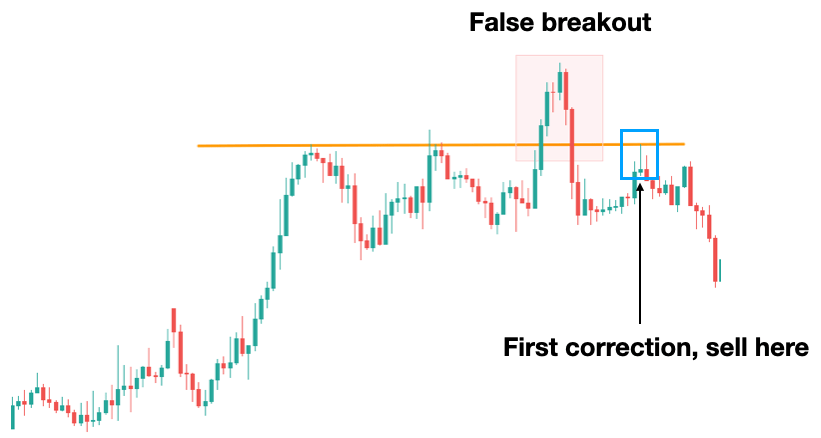
For instance, some traders might wait until the market returns above/below the level after the “false breakout,” then buy or sell.
Others might wait a bit more until the market departs from the level and makes its first correction. Only then would they open a position.
These examples are more than enough to give you some ideas about how to trade institutional candles.
Again, if you want to maximize your chances of success, you must scrap most of the set-ups (there will be a lot, especially if you trade small charts) and focus on the very best opportunities, similar to what we explained a little above.
You might also want to practice and backtest any idea you have before risking real money.You can read our guide on backtesting here.
Conclusion
You’ll never know for sure when a market is being manipulated, but even without this information, institutional candles can be useful tools in your strategy.
They will make you wait until you get a great price for your trade.
This will boost your profits and help you master patience, which is a valuable trading skill.
Despite their potential, don’t expect institutional candles to be a secret loophole leading to endless profits.
You can benefit from using them in your trading, but not if you take excessive risks or waste your time on mediocre setups.
Try to backtest the technique to see what works and what doesn’t and focus on the very best trades, similar to the euro-dollar example we explained.