Let’s say you missed out on a large price increase.
How does it feel? Probably not very good, right?
Most of us know from experience how frustrating it is. Luckily, we’ve been trading for years, so we’ve learned a thing or two about making the most out of these misfortunate situations.
That’s where forex flag patterns come into play.
Forex flag patterns appear after a strong price move and suggest yet another strong price move in the same direction. In other words, even if you miss the initial move, you can still jump on the action by watching for bullish or bearish flags.
So, are you curious to learn more about these patterns?
In this article, you’ll get the answers to these questions:
- What is a flag pattern in forex?
- How do you trade forex flag patterns?
- When should you trade a flag pattern?
- Can a bullish flag turn bearish (and vice versa)?
First, let’s make sure we’re on the same page about what forex flag patterns are.
What is a Flag Pattern in Forex?
The forex flag pattern is a chart pattern that appears when a trend begins to accelerate. It consists of a few large candles in the direction of the trend and a smaller retracement thereafter. It suggests another big move in trend direction.
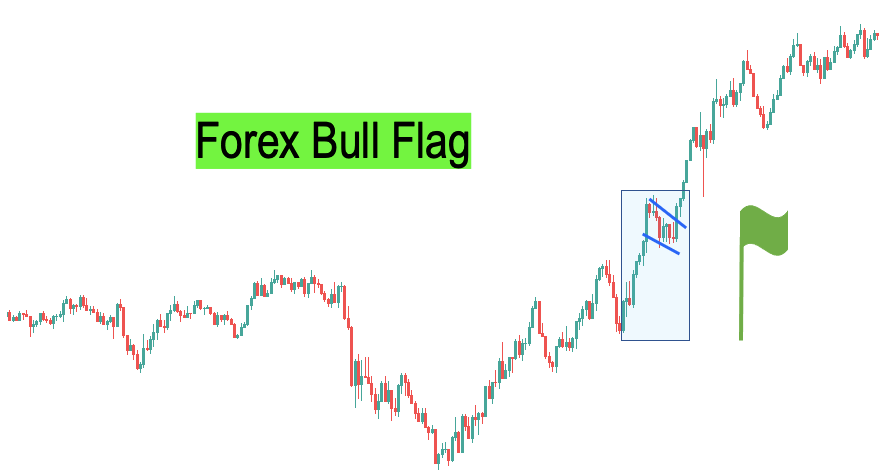
The bullish flag occurs when the price quickly shoots up and begins consolidating. The advance is expected to continue after the consolidation.
The bearish flag is identical to its bullish counterpart except that it forms when the price consolidates after a big selloff. It is often the precursor of an additional big move downward.
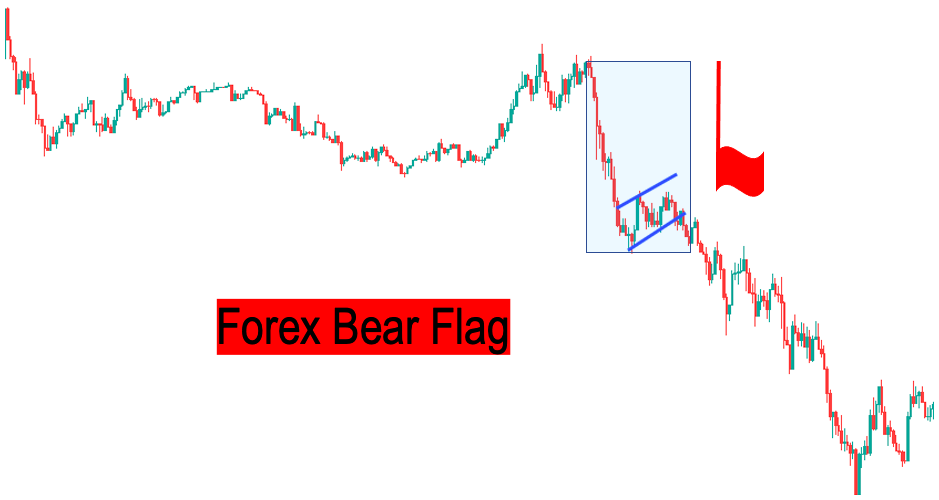
You can see that in both cases, flag patterns consist of two parts: the flagpole and the flag itself.
The first part of the flag pattern is a huge price jump (or fall), which is the result of algos and day traders immediately getting in on the action when something surprising happens.
They quickly bid up the price (or send the market into freefall), but the move eventually reaches a climax. When the market slows down, early birds take profits, and a countermove develops where the market relinquishes some of its gains (or recovers some of its losses).The initial directional move paired with the subsequent countermove results in a structure similar to a flag on a pole—hence, the name of the pattern.
Let’s talk about how you can trade bullish and bearish flags in forex.
How Do You Trade Forex Flag Patterns?
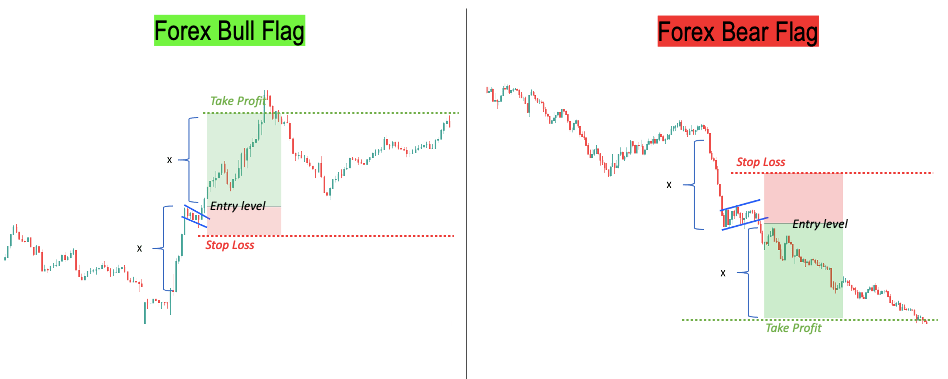
How to trade in a forex flag pattern depends on whether the pattern is bullish or bearish. For bull flags, place your stop-loss below the consolidation low and your take profit above the entry price at a distance matching the height of the pattern. For bear flags, do the opposite.
Let’s discuss!
If you’re considering a forex flag pattern trade, chances are you have already missed out on the initial big move.
Luckily, because the first wave of trades is usually generated by algorithms, it can be followed by more waves when other traders take notice and jump on board. Your goal is to get in after the early traders but before everyone else.
Unfortunately, it is easier said than done.
It is simple to define your risk when you buy against a horizontal support level; you just place your stop-loss below support. If you lose on the trade, the support level didn’t hold, and your idea was wrong.
When you trade forex flag patterns, you’re buying and selling into pullbacks. This is more difficult because the extent of these pullbacks is hard to know in advance.
Many traders are afraid to miss the second large move, so they will open a trade as soon as possible. This is called FOMO (fear of missing out), and it is dangerous because it might take a while before the market resumes its trend. You can burn yourself multiple times if you’re trying to catch breakouts too early.
If a big move has already occurred, don’t fall victim to FOMO. The forex flag pattern might give you another opportunity, but you must be patient and not trade until everything is fully aligned. This is the #1 rule for this setup: be patient.
In the following, we’re going to take a separate look at the bullish and bearish flag patterns and explain what to be mindful of when trading these patterns.
How to Trade the Bullish Flag Pattern
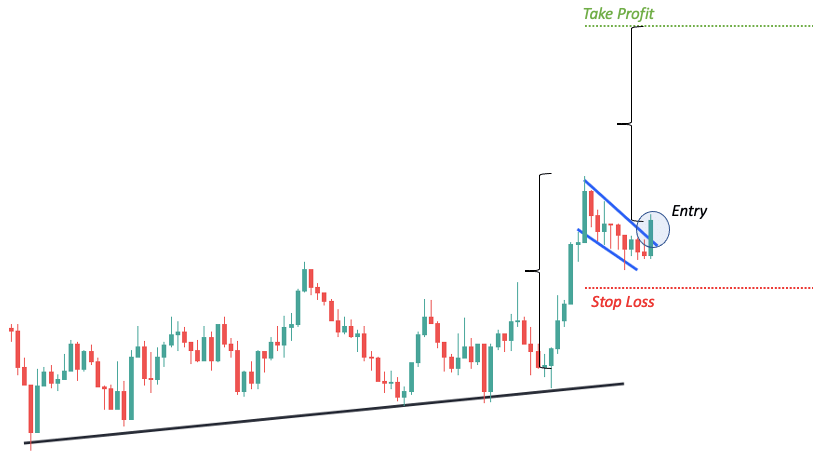
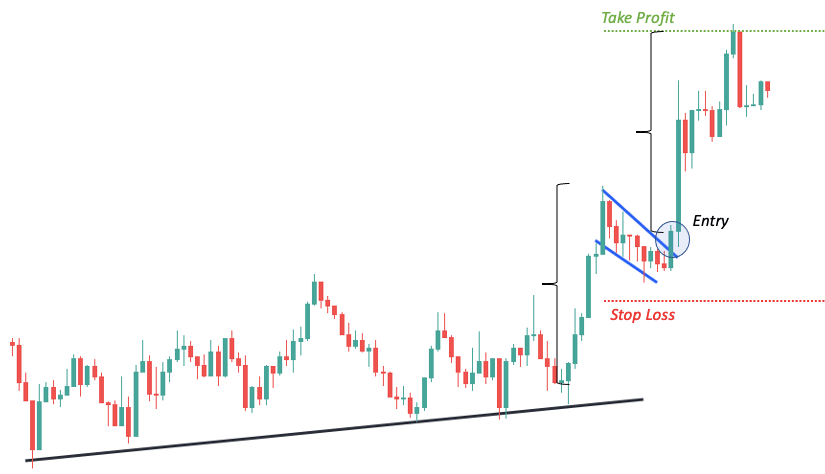
Consider the following example a long setup based on the bullish flag.
This guide belongs to Forexspringboard.com. Do not copy without permission.
Let’s break it down.
First of all, notice that we can draw an upward sloping trend line. (Read this guide to learn more about trend lines.)
This is an important aspect of the bullish flag. The market needs to be in an uptrend. It doesn’t have to be crazy bullish, but the mood needs to be positive.
All of a sudden, the uptrend begins accelerating. There is a strong bullish push upwards and the price makes a new high.
This is not yet a flag pattern, but you should be excited. Not too excited to open a trade, but excited enough to prepare for going long.
It’s important to be patient. Sometimes the price will continue rallying almost immediately, but usually there will be a longer retracement and anyone who bought the top will be stopped out.
Trading forex flag patterns will help you here because the trade is delayed until there’s a decent retracement as it is needed to identify the flag portion of the pattern.
That said, the price can decline much further than you expect while the pattern remains valid, so you need another layer of security. In other words, having a well-defined flag is not enough; you must have a clear trigger to support the trade entry.
Most traders will wait until a strong bullish candle closes above the upper trend line. It is important to wait until the candle actually closes above the trend line as multiple candles might penetrate it during the consolidation phase, tricking you into buying prematurely.
At this point you’re only inches away from opening the trade, but you must first decide on the stop-loss and profit target. The stop-loss is especially crucial as it influences the position size you’re going to use.
A good stop placement for the forex bull flag pattern is on the other side of the flag, just below the consolidation low.
As for the profit target, you can use the height of the pattern. Simply measure the distance between the bottom and top of the flag pattern and add the pip amount to the entry price. Then place your TP to this price level.

This concludes our explanation on how to trade forex flag patterns in an uptrend. Now, let’s look at the bearish flag.
How to Trade the Bearish Flag Pattern
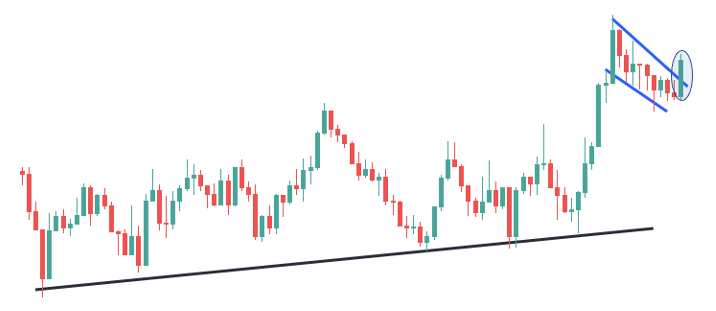
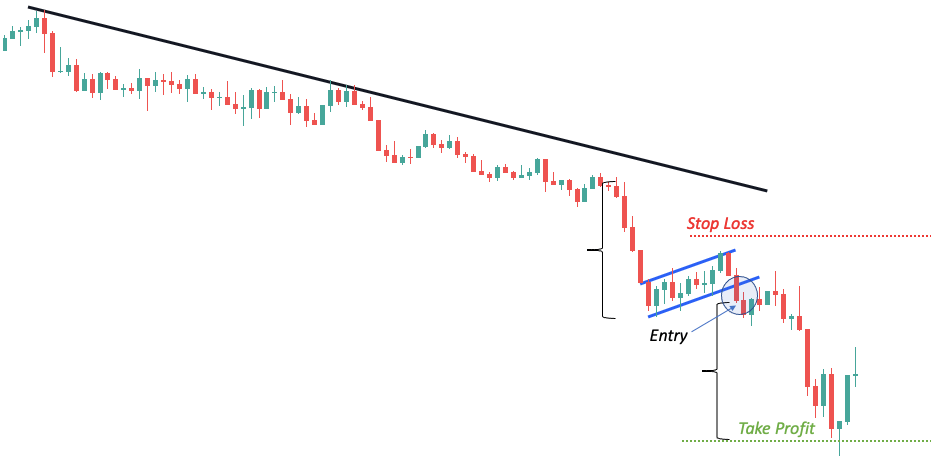
Here’s an example of a short setup based on the bearish flag.
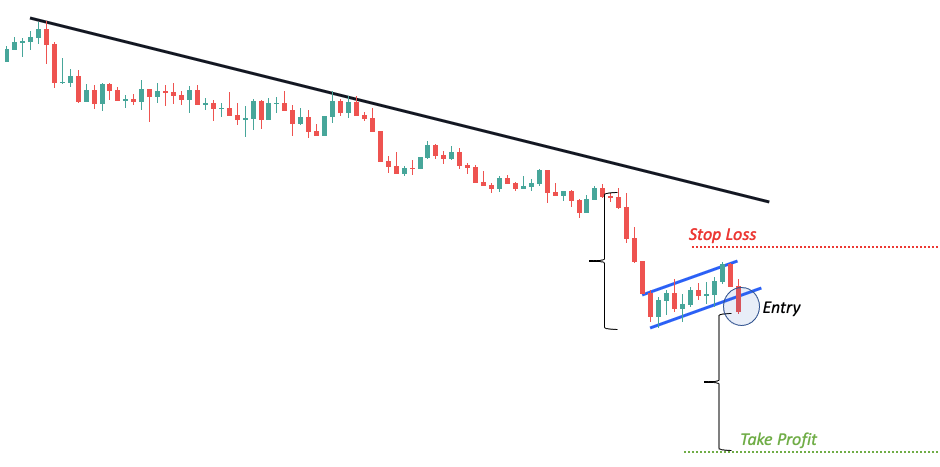
Let’s break it down.
You can see from the slope of the trend line that the market has been trending down, so it is a good starting point to prepare for the possibility of a bearish flag pattern.
The first important clue regarding an impending setup is that the market makes a sudden push downward and forms a new low. Once the sells go through, the price begins to rise slowly. This is a really good indication that a bearish flag will emerge.
Like we said before, it’s important to be patient here. Of course, you don’t want to miss the next big move down, but you also don’t want to enter too early while the market is still retracing.
Trading bearish flag patterns is sure to test your patience as you must wait for a decent retracement to be able to identify the flag portion of the pattern.
It is generally difficult to estimate how far the price will retrace. Once you have identified the flag with two parallel trend lines, look out for a clear trigger, such as a strong bearish candlestick, before opening the trade.
It is important to wait until the candle actually closes below the trend line as multiple candles might penetrate it during the consolidation phase, tricking you into selling prematurely.
When placing the trade, make sure to take care of your stop-loss and profit target.
A good stop placement for the forex bear flag pattern is on the other side of the flag, just above the consolidation high.
As for the profit target, you can use the height of the pattern. Simply measure the distance between the bottom and top of the flag pattern and subtract the pip amount from the entry price. Then place your TP to this price level.
When Should You Trade a Flag Pattern?
Forex flag patterns around important news can be particularly effective if the news comes as a significant surprise to the market. In this case the likelihood of another big move is high as the knee-jerk reaction is often followed by more trades in the same direction.
For example, let’s assume that the US economy is performing well, and oil prices have recently collapsed. The USD/CAD is trending up as traders long USD and short CAD knowing that low oil prices will hurt the Canadian economy and boost the US even more.
The market is expecting a strong US jobs report with the consensus being that the economy will add about 70,000 new jobs. The day arrives and traders nervously watch the clock tick until the number is finally revealed: 3…2…1: +120,000 jobs!

Nobody expected such a strong release.
Bots and algorithms will immediately bid up the price significantly. But the wild jump will quickly plateau, and the market will begin to fall as some long positions are being closed for profits and a few contrarian traders fade the move.
In this case, if the price action forms a flag pattern, chances are you have found a stellar trade opportunity.
No matter how useful they are, algos can’t always take full advantage of the news event. They can’t interpret and contextualize the situation as well as humans do, plus they have risk limits that restrict their buying.
Thus, when an economic release is well above expectations, the first wave of algo buys is frequently followed by more buying waves as human traders catch up and hedge funds add to their positions.As these buys roll in, the price starts to increase again, and you’ll see a breakout from the forex flag pattern. This will attract even more buyers and algorithms resulting in another quick run up in prices.
That’s why forex flag patterns around high impact news can be effective if the news comes as a significant surprise to the market.
Can a Bullish Flag Turn Bearish (and Vice Versa)?
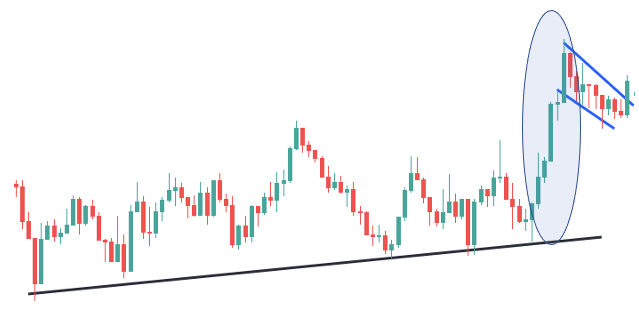
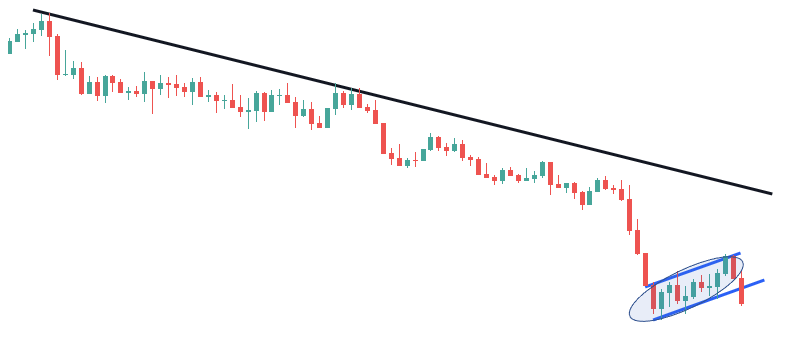
The bullish flag pattern is not infallible, and it can definitely turn bearish.
In this case, however, the market may not to provide a trade trigger (strong bullish breakout from the flag), so you sometimes spare the loss by not having an open trade.
In fact, you might even decide to trade the failed bullish flag and go short. There are situations when this can be a reasonable and high-probability move.
For instance, when an economic news release emerges with a strong headline number and weak details, there will often be a huge jump as traders pile in based on the initial reading. Then, when traders realize that the details are not as strong as the headline, they get out of the trade and there’s a rapid turnaround.
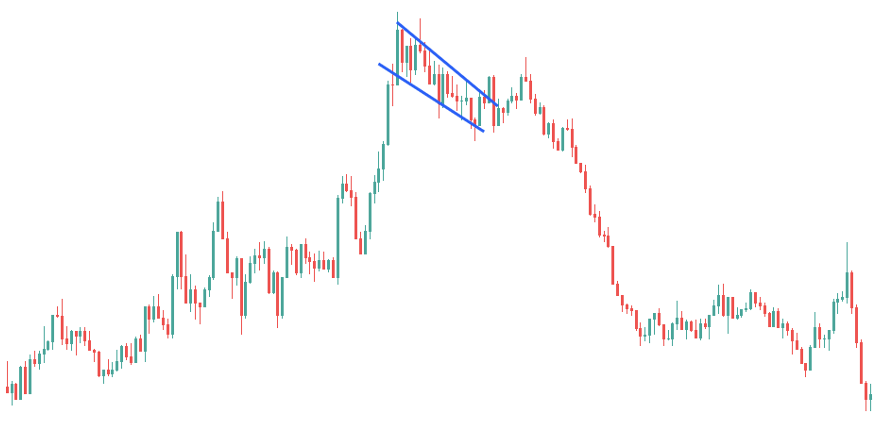
This is a classic example of a bullish flag turning bearish and it can make for a good trade opportunity.
The disadvantage of this type of trade is that it is generally hard to implement as you must pay attention to many things and act quickly.
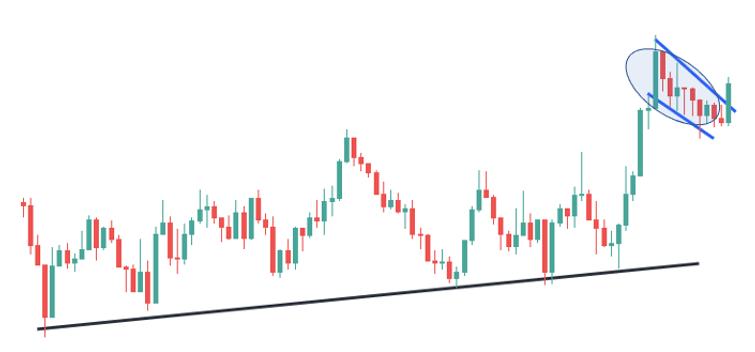
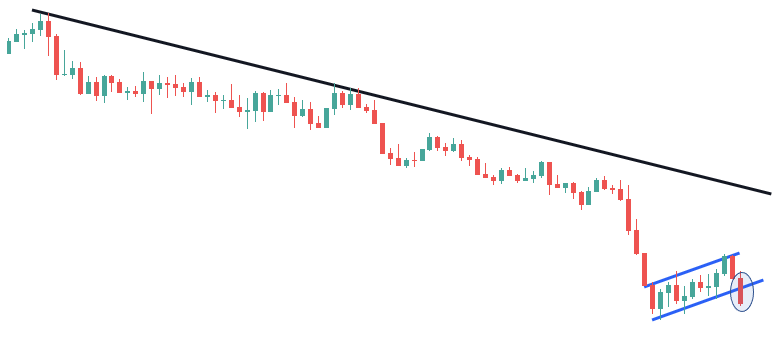
Of course, a bear flag can also break up. Here’s an example:
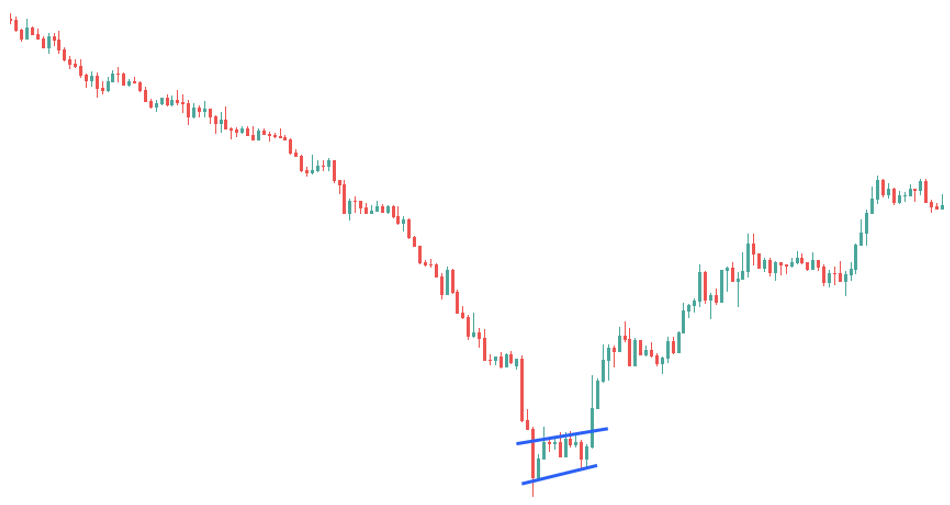
The scenario is the same but in reverse.
Frequently Asked Questions About Forex Flag Patterns
The flag pattern is a chart pattern that appears when a trend begins to accelerate. It consists of a few large candles in the direction of the trend and a smaller retracement thereafter. It suggests another big move in trend direction.
For bull flags, place your stop-loss below the consolidation low and your take profit above the entry price at a distance matching the height of the pattern. Do the opposite for bear flags.
Forex flag patterns around important news can be particularly effective if the news comes as a significant surprise to the market. In this case the likelihood of another big move is higher as the knee-jerk reaction is often followed by more trades in the same direction.
Yes. A classic example of a bullish flag turning bearish is when an economic news release comes in with a strong headline number, but the details are weak. Traders will bid up the price based on the initial reading but quickly close their longs upon realizing the mistake.
Conclusion
Forex flag patterns are useful formations that occur during active markets.
Many people love to trade them because they allow for fast profits if successful. But there are also risks that you should be aware of. False breakouts from these patterns can be frequent sources of losses and frustration.
As always, practice proper risk management and don’t rely solely on one thing. Both bull and bear flags can be combined with fundamental analysis effectively, so this might be an area you want to study further if you are interested in trading these patterns.