A simple drawing tool that every charting platform has is the trend line.
Traders use trend lines to illustrate the direction of the market by connecting prices on the chart. At first sight, drawing trend lines is easy, but you can quickly get lost in the details.
Turns out, the same chart shows several trends, so it’s not immediately clear which trend to use. There are also further challenges such as which prices to connect and how many touches should be included.
We made this guide to clear those confusions up. By the end of this guide, you will know exactly how to draw trend lines on forex charts.
Understand This One Thing First
Before you can draw proper trend lines you must understand that time frames are interconnected.
You might focus on one specific time frame, such as the hourly, but it is the time frames under the hourly chart that create the chart’s patterns. Patterns on the hourly chart influence patterns on higher time frames.
To illustrate, we’ll go down to the 1-minute time frame and work our way up to larger time frames. It’s going to be a lot of fun to see how everything comes together to form the big picture.
So, let’s look at the 1-minute chart first.

Each minute the charting platform records where the price opened and closed, and the high and low prices during that minute. These records resemble candles, and they are chained together to form what’s called a candlestick chart.
Information from this 1-minute candlestick chart is condensed into the 5-minute chart. The patterns on the 5-minute chart are the same as those on the 1-minute chart, but some information is omitted because candles are printed less frequently.
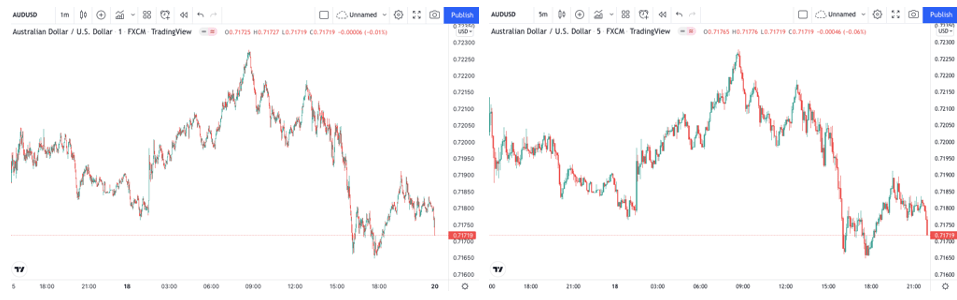
This allows the 5-minute chart to cover a longer time period. If you zoom out, you can see that the 1-minute chart covers the past day or two while the 5-minute chart shows about a week of price action.

Data on the 5-minute chart is combined to form the 15-minute chart, which is combined to form the 30-minute chart, which is combined to form the hourly chart, and so forth.
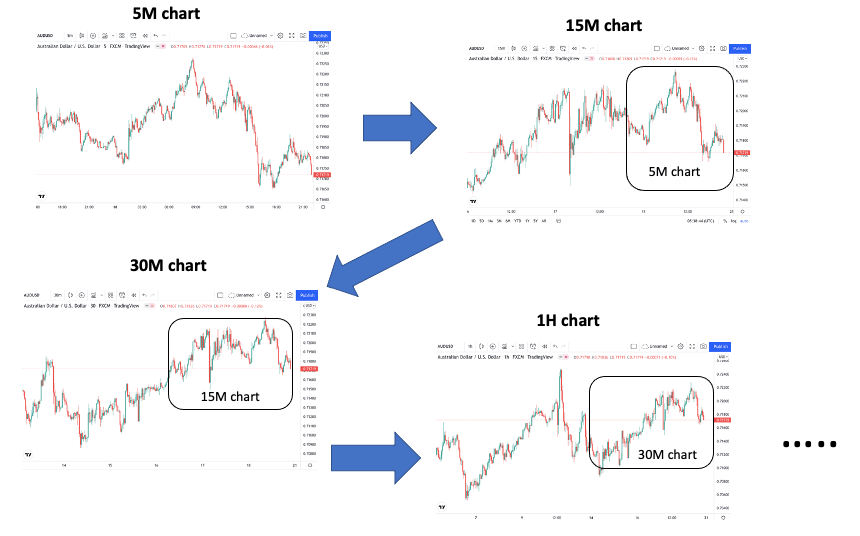
The pattern building continues all the way up to daily, weekly, and monthly time frames.
Even though you are analyzing one time frame, it is possible to see trends belonging to other time frames. This can be confusing as it is often not obvious which trend is the “correct” one or where to draw the trend line.
Luckily it is simple to resolve this problem. But first, let’s learn how to draw trend lines.
How to Draw Trend Lines on Forex Charts
You have already learned how different charts interact with each other. This important step allows you to create the structure you need to use successful trend lines in trading.
So, without further ado, it’s time we walk you through how to draw forex trend lines.
This section consists of two parts.
First, we’ll show you how to draw trend lines. This is the foundation for beginners. Once you are done reading it, you can jump straight into any chart and start drawing up trend lines with confidence.
Then, we’ll examine how trend lines on different time frames interact with each other. This will allow you to categorize trend lines based on their strength and avoid getting baffled by contradictory signals.
How to Draw Trend Lines Correctly for Beginners
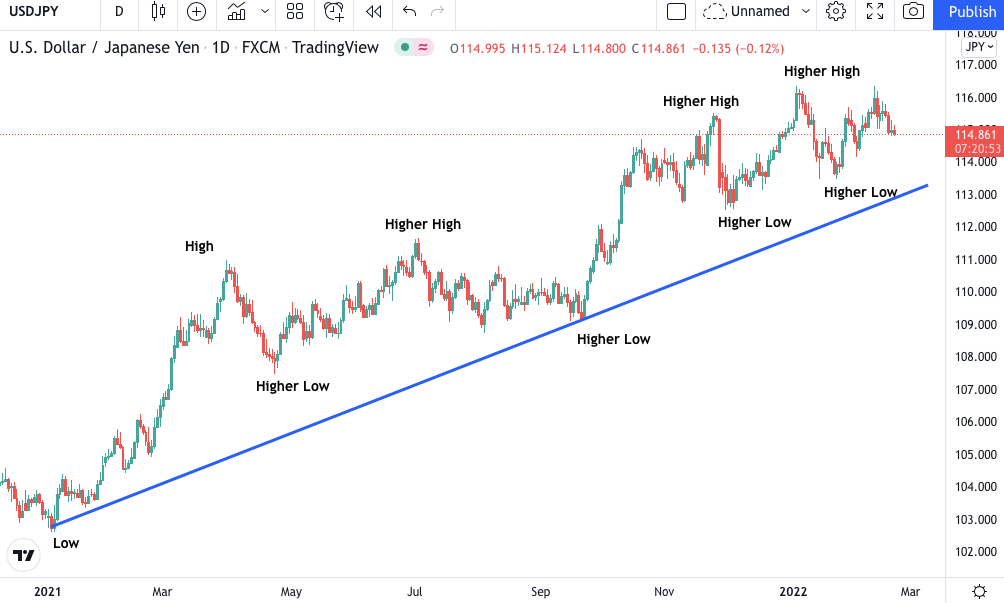
You might already know that an uptrending market makes higher highs and higher lows. A downtrending market is one that makes lower highs and lower lows.
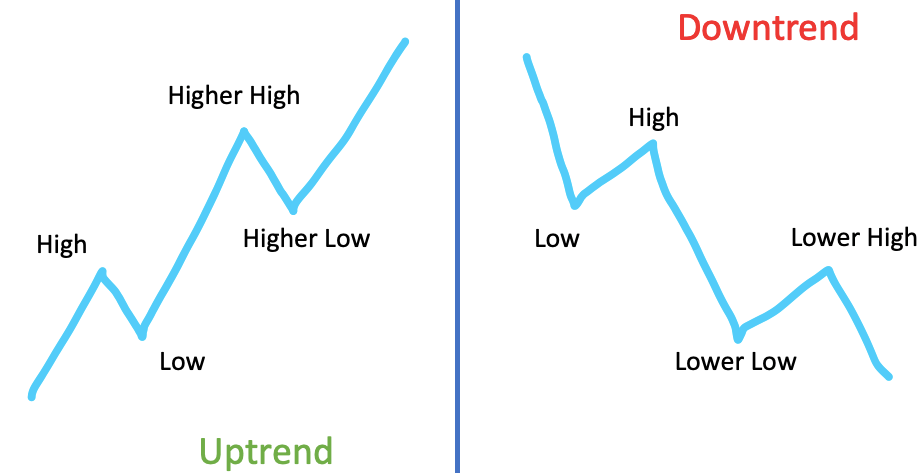
You draw trend lines by connecting the highs or the lows—depending on the trend.
| Uptrend | Downtrend |
|---|---|
| In an uptrend, you draw a trend line by connecting lows. As the market advances, the lows occur at higher and higher prices resulting in an upward sloping trend line. | In a downtrend, you draw a trend line by connecting lows. As the market declines, the lows occur at lower and lower prices resulting in a downward sloping trend line. |
Trend Line Example: Uptrend
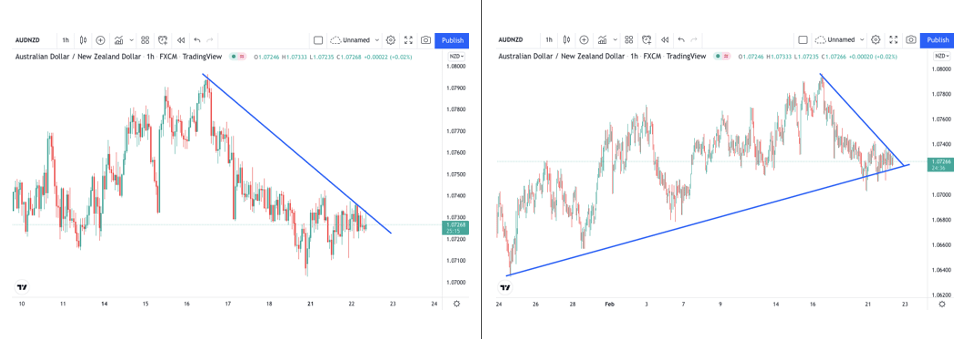
Trend Line Example: Downtrend

There are a couple of things to bear in mind when you draw trend lines.
There are multiple highs and lows in each trend, which can be confusing for new traders. You want to focus on price points that stand out.
These will have significant “room to the left” as they are located at price levels where the market has not traded in some time.
It’s a good idea to lay down some rules for yourself. For example, you might decide to only draw up trend lines that connect highs or lows that have at least ten candles to the left. This will help to avoid confusion about where to draw the trend line.
Don’t worry if not all highs or lows fit to your line. You only need two points to draw a trend line. You can always aim to include more touches but don’t go crazy over it.
The key is not to have the most touches nor it is whether you connect wicks or closing prices. Instead, it is to understand what the market is telling you. Keep on reading for a more elaborate discussion on this.
Drawing Trend Lines Using Multiple Time Frame Analysis
At the beginning of this guide, we explained that time frames are interconnected. No trends exist in the vacuum of a single time frame. Thus, the same chart can show multiple trends.
For example, the market might be falling on the 1-hour chart but zooming out from the same hourly time frame can show an entirely different picture.
What should you do in situations like this? How do you know which trend line to trust?
To avoid confusion, you must utilize a top-down approach. Each time you analyze a currency pair, begin with a broad view on the market and gradually work your way down until you reach your traded time frame.
Looking at higher time frames first will provide context for market structure within your trading time frame.
There is no real limit as to how many time frames can be monitored or which specific ones to choose, but there are general guidelines that most traders follow.
A good starting point is to use three different time frames:
- Long-term
- Medium-term
- Short-term
First, you can draw up the main trend in addition to the strongest support and resistance zones on the long-term time frame.
Then, you can head over to the medium-term time frame and technically do the same exact thing. Of course, this time, locate smaller moves within the broader trend plus the medium-term support and resistance zones.
Finally, you can find your entry and exit points on the short-term time frame.
For example, you might use:
- 30-minute, 5-minute, and 1-minute
- 4-hour, 1-hour, and 30-minute
- Daily, 4-hour, 1-hour, and so on
In the following, we’re going to walk you through a practical example.

How to Use Trend Lines for Intraday Trading
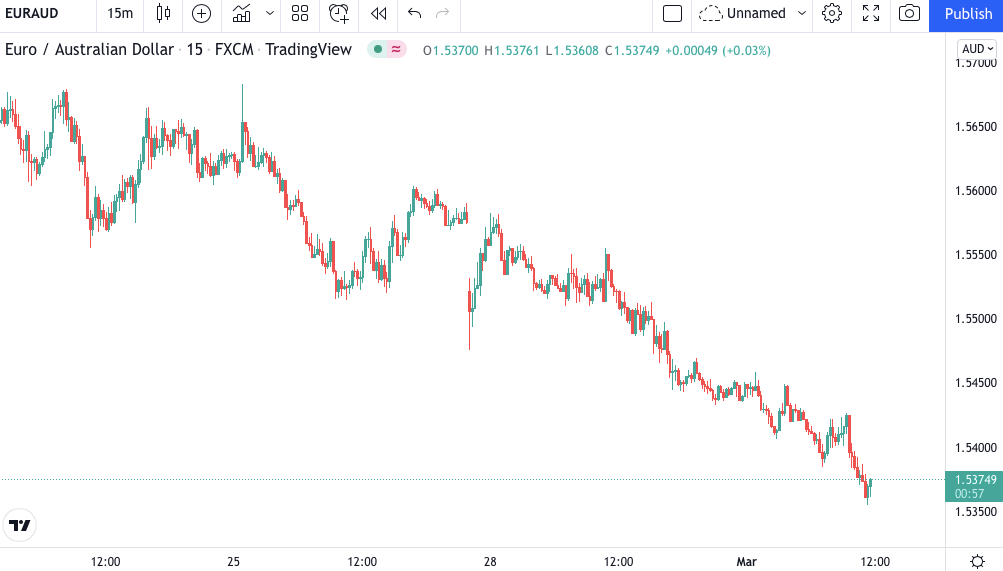
Let’s say we want to trade the 1-minute chart.
First, we pick a relevant long-term time frame. Let’s settle on the 15-minute chart. Then we investigate if the price is trending and whether or not we can draw a trend line.
Just by eyeballing the chart, you can see that there’s a steady downtrend.
There are modest corrections and well-defined highs that allow us to draw a nice trend line. To draw a trend line in TradingView, as shown below, select “Trend Line” from the drawing panel on the left-hand side.
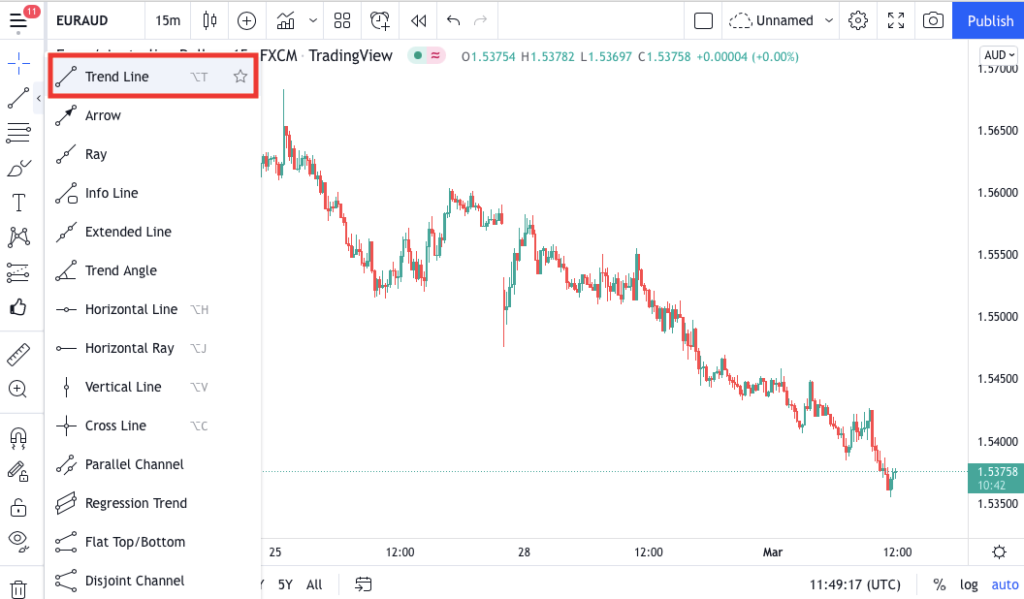
We’re going to connect the two prices that stand out the most.
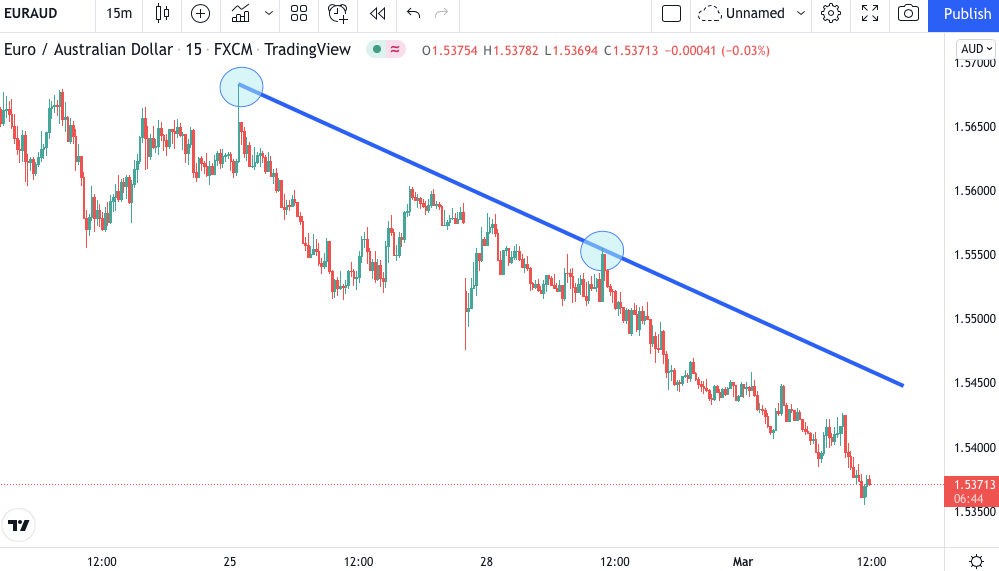
Note that we have also increased the thickness of the trend line to distinguish it from trend lines we’re going to draw on lower charts. Most charting platforms will allow you to do this. In TradingView, you must right click on the trend line, go to “Settings,” and select a different line thickness under the “Style” tab.
Once the 15-minute trend line has been drawn, we move on to the 5-minute chart. This will be our medium-term time frame that we can draw up and adjust the thickness like before.

As the last step, we repeat the process with the 1-minute time frame.

In this example all three time frames point in the same direction. So, how do we use this information? Was it useless to browse through all these different time frames?
No, not at all.
We can come up with various trade ideas on the 1-minute chart using the current market structure.
We know that the market trend is down, but we also know that the market is quite oversold. A potential setup could be to wait for the 1-minute trend line to break and buy the upward correction to grab a few pips of profit.
The 5-minute trend line can provide a good profit target for this trade since the selling pressure might intensify around this area and result in the continuation of the downtrend.

Of course, it’s always risky to buy in a falling market or vice versa. However, even devoted trend traders recognize that overextended trends come with an increased likelihood of market correction and will often wait for a pullback before pulling the trigger.
Another trade opportunity would be to wait until the price begins to rise and use our insight of the market structure to time the short trade.
For example, we might wait until the price reaches the 15-minute trend line and then go short.
Notice that the move upward to the 15-minute trend line will look like a steady uptrend on the 1-minute chart. That said, we’re not going to get tricked into buying because we know that this is only a correction in the big picture.
We’ll patiently wait until the price climbs up to the 15-minute trend line and then go short with an amazing risk to reward ratio.

Conclusion
In this guide you have learned how to easily draw trend lines on forex charts.
When it comes to trend lines there’s an endless debate on the proper number of touches and if you should use wicks or closing prices. These discussions tend to miss the point that trend lines only go as far as your ability to interpret the market structure.
Of course, it is painful to see that you wouldn’t have stopped out if you had drawn your trend line differently. But it is much more important to understand the big picture and make well-rounded bets than it is to obsess over better methods for drawing trend lines.