We’re sure you’ve figured out by now that technical analysis has a lot of elements.
If you’re quite new to this, there’s a good chance you’ll come across concepts that you don’t fully understand. Forex channels or price channels might be one of them.
In essence, channels are chart patterns that show you where you can expect support or resistance zones. For example, if the price approaches the upper edge of the channel, the trend might be overextended and about to reverse.
Now, of course, this is just the core principle. The reality is more in-depth. There are different types of channels and several possibilities for incorporating them into your strategy.
So, whether you’re entirely new to technical analysis or just want to learn more about various techniques, this guide will serve as a perfect introduction to forex channels.
Understanding Forex Channels
As we’ve mentioned, forex channels are used to show support and resistance zones. However, this is a pretty vague definition. We want to break it down even further so you can fully understand what channels are.
If you have seen a chart or two in your life, you have probably already encountered situations in which the price was trending in one direction. You may have also noticed that instead of moving in a straight line, every trend has humps and bumps.
In many cases, you’ll see the price moving as if it were bouncing back and forth between two parallel lines. If you take the time to properly mark these lines on your chart, you’ll get the price channel that we’re talking about in this guide.
Here’s a visual representation of this:
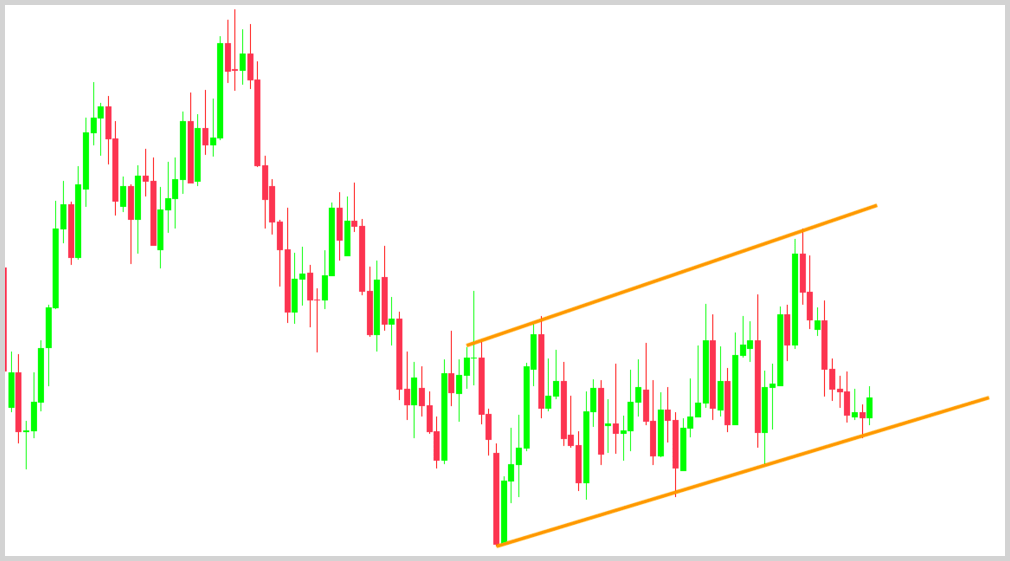
As you look at many forex channels, you’ll see that the price often remains in the channel for a longer time. This is the reason why traders care about channels in the first place. Channels can present you with many trading opportunities!
For example, when the price goes through a correction phase in an uptrend, you can wait until it reverts to the lower edge of the channel and then open a long position.
Types of Channels
Before you start analyzing forex channels, you must understand the two main types. Depending on whether you construct your channels using trend lines or by applying a technical indicator, we can talk about trend channels and envelope channels.
We’ll go into greater detail on each of these below.
Trend Channels
Trend channels are constructed by using two parallel trend lines. There’s an upper trend line that connects the highs, and there’s a lower trend line that connects the lows.
Now, it’s important to note that the words “high” and “low” have two meanings.
We can talk about the high or low of a specific day’s candle or the high or low point of a bigger price move. The latter is called “swing high” and “swing low.” When identifying trend channels, you must find swing highs and swing lows.
So, how do you do that?
Here are the criteria we use:
Swing High:
Right side: Lower High
Left side: Lower High
Swing Low:
Right side: Higher Low
Left side: Higher Low
Here’s an example that should put things into perspective:
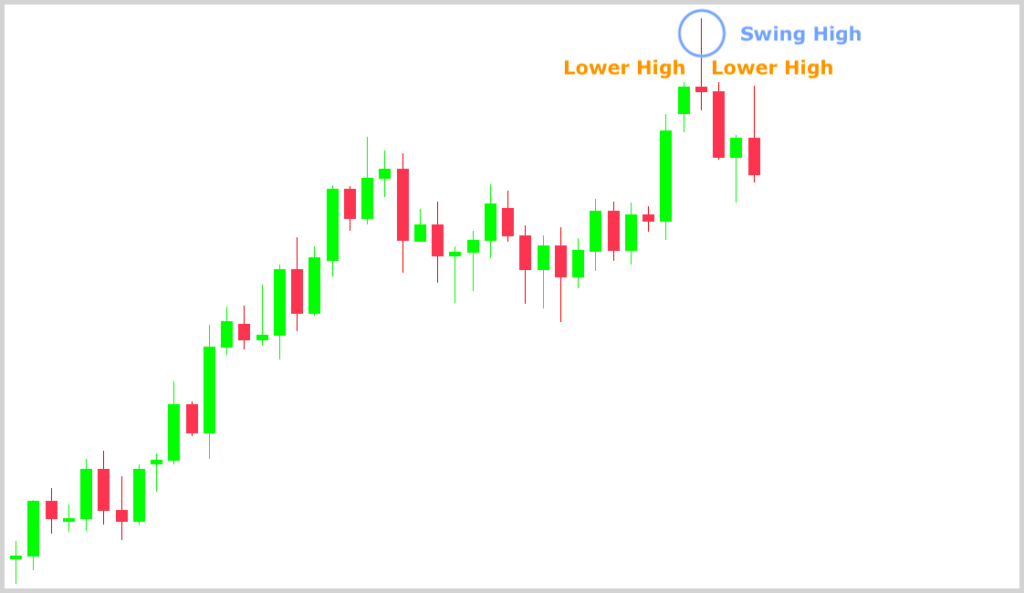
First, take a look at the circled candle. Now look at its right side and at its left side. In both cases, those candles have a lower high than on the day we have circled. This is a simple and objective way to identify swing highs.
Reverse engineer this concept for swing lows.
Now that you know how to identify these points on your charts, you can draw forex channels. Depending on the trend, you will create an ascending, descending, or horizontal channel. Don’t worry, you can’t go wrong here.
Ascending Channel
An ascending channel is a channel that you draw in an uptrend.
You may know that higher highs and higher lows characterize an uptrend. As a result, when you connect your swing highs and swing lows, you’ll get two ascending lines.
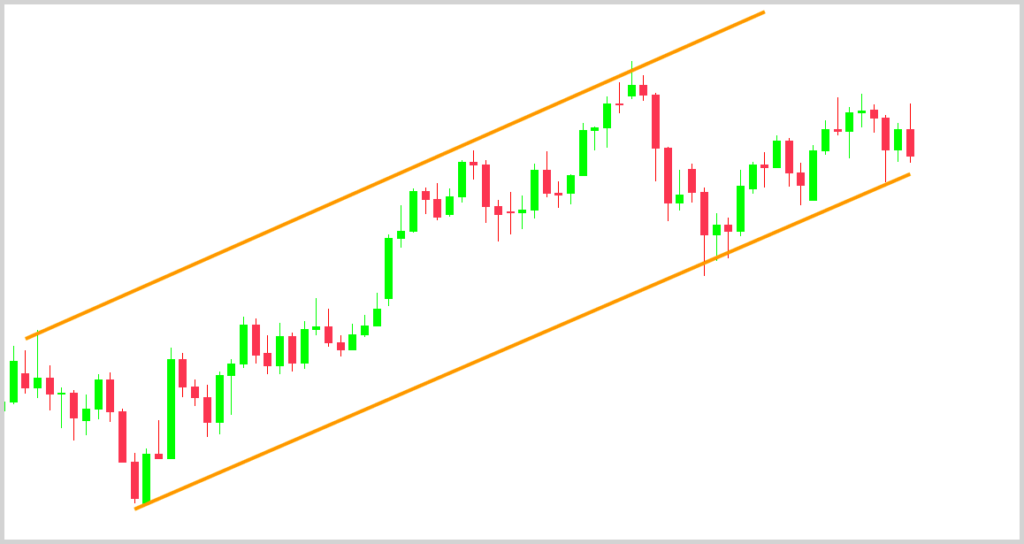
When constructing the channel, make sure to connect the swing points in a way such that both trend lines are parallel to each other. If that’s not possible, don’t force the price. It’s not always possible to draw a channel.
Descending Channel
A descending channel is a channel that you draw in a downtrend.
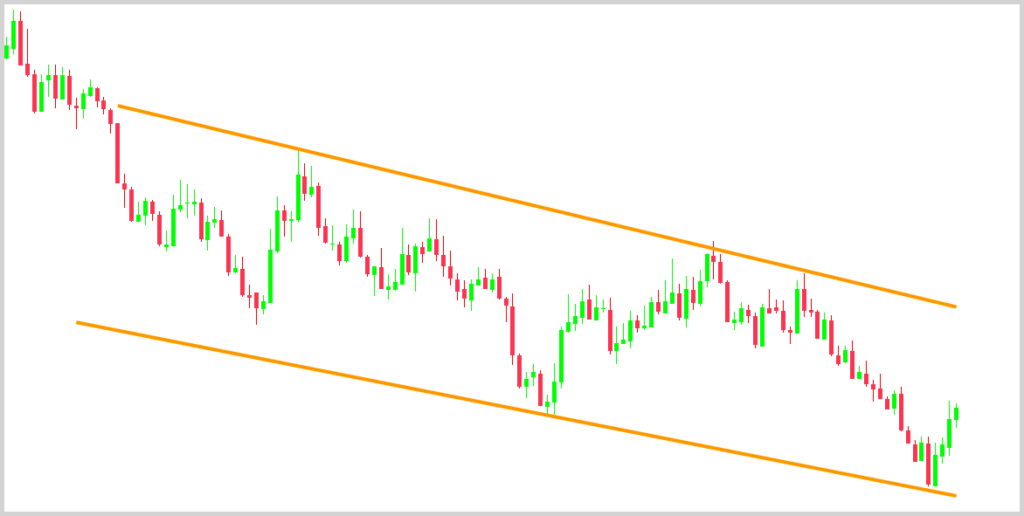
As opposed to uptrends, a downtrend is characterized by lower highs and lower lows. Therefore, when you connect your swing highs and swing lows, you’ll get two descending lines.
Again, both trend lines must be parallel to each other. If you can’t connect the swing points that way, don’t draw an incorrect channel.
Horizontal Channel
Flat channels have many names: horizontal channels, sideways channels, and ranging channels, to name just a few. These all refer to the market condition in which there’s no clear direction and the price is bouncing between support and resistance.
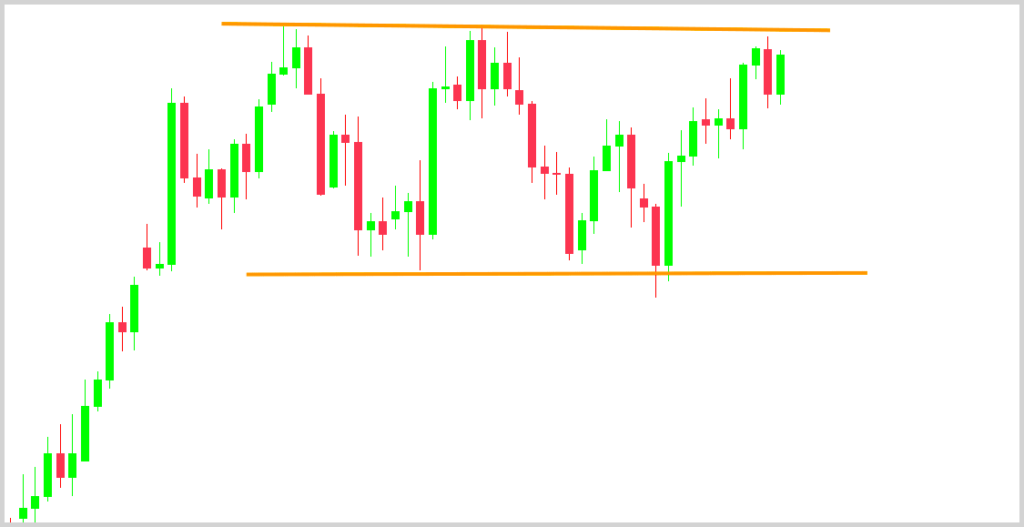
You see, a flat channel is quite easy to draw. You just need to indicate the support and resistance areas with two horizontal lines. Make sure you draw your lines to the most congested regions with as many touches as possible.
If you need more information about the concept of support and resistance, as well as some great strategies, check out our article, which explains everything in a straightforward manner.
Envelope Channels
Envelope channels are those that are created using technical indicators.
Almost every trading platform comes with plenty of free technical indicators. What is common among these is that they can help you generate objective trading signals.
However, different indicators are designed for different purposes. If you want to create envelope channels, your best options are Bollinger bands and Donchian channels. These indicators are used in most channel trading systems.

Both plot “responsive channels,” meaning that the channel’s width changes in response to market activity. We’re not going to get into complicated calculations, but there are some key differences, so it’s worth examining them individually.
Bollinger Bands
Bollinger bands were developed in the late 1980s by an analyst named John Bollinger. In these channels, the resistance and support areas are based on the movement of a moving average.
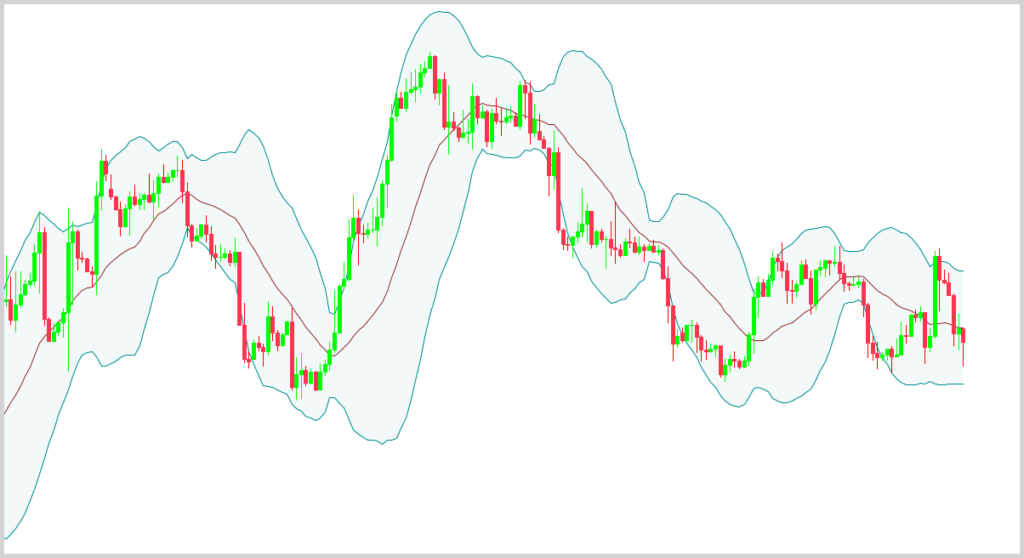
The indicator comprises three lines:
- A simple moving average (middle band),
- An upper band,
- A lower band.
The simple moving average is just what it sounds like: a moving average with a typical period of 20. To understand the bands, you must know the concept of standard deviation.
The standard deviation measures how far a currency pair’s price is from its average price.
In essence, the upper band is created by adding the doubled value of the standard deviation to the SMA, while the lower band is created by subtracting it.
Donchian Channels
Donchian channels were created by Richard Donchian, an American trader and money manager who designed the indicator to help him identify price trends.
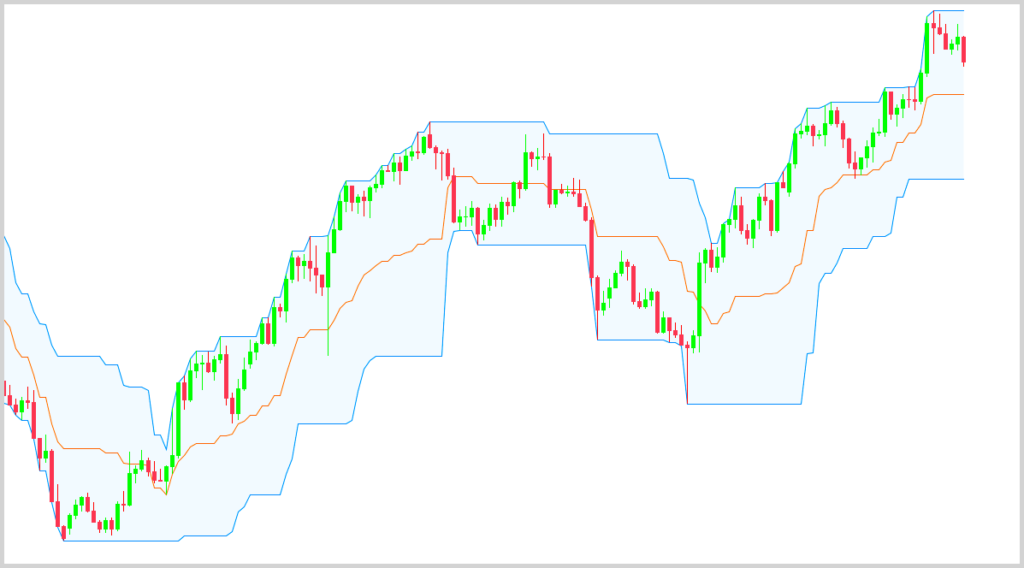
Similar to Bollinger bands, it plots three lines on the chart:
- The upper line is the highest price for the last n period,
- The lower line is the lowest price for the last n period,
- The median band is calculated simply as (Upper Band + Lower Band) / 2.
(The default value for n is usually 20.)
As you can see, the most important difference between Donchian channels and Bollinger bands is the calculation. Donchian channels have a less balanced calculation, which means that significant high or low prices have a bigger impact on the indicator.
How to Trade Forex Channels
If you put a moving average on your chart, you’ll see the average consensus of value during a specific timeframe. But, of course, there are frequent excursions from that area. We use channels to define where the extremes might be.
When the price is at the lower edge of the channel, you can say that the market is undervalued. On the other hand, when the price is at the upper edge of the channel, you can say that the market is overvalued.
You can use the points where price engages the channel as de facto trading signals, but we recommend incorporating other supporting factors. Either way, let’s see two of the popular channel trading strategies.
Fade Move Outside the Channels
This is a contrarian strategy, meaning that you use it to trade against the trend. It’s always riskier to go against the market, so make sure you have a solid risk management plan before you do anything.
If you’re new to risk management, watch this 30-minute video from NoNonsenseForex:
It will put you on the right track.
Now, back to the strategy. We’ve recently mentioned that channels can mark the limit of mass optimism and pessimism. Fine, but what if either buyers or sellers are much stronger than the other party?
That’s when the price may break above or below the channel. When this happens, the outcome can be twofold:
- The price can remain outside the channel for a long time, or
- It can get exhausted and almost immediately return to the channel.
When fading a move, you’re betting on the latter.
Fading makes sense only if the market is unreasonably extended. You must look for sudden and explosive price moves and then open a position in the opposite direction. Here’s an example:
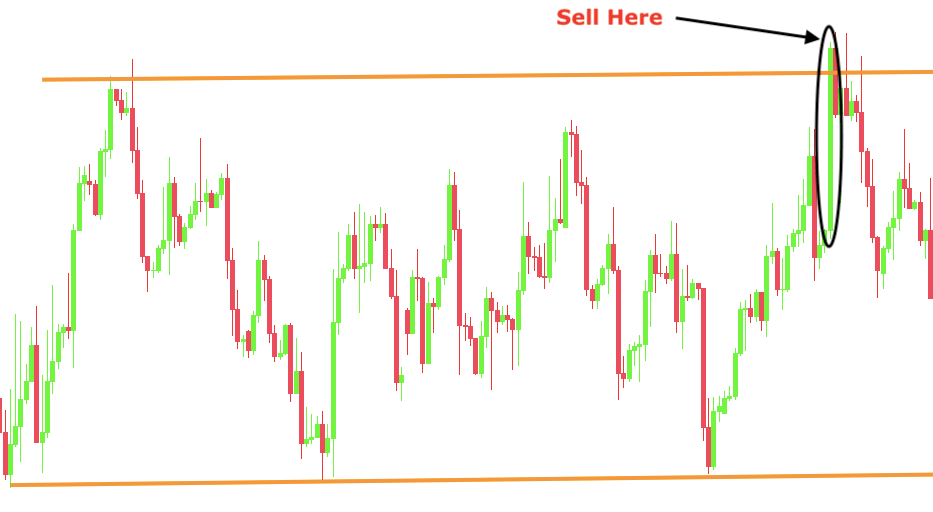
The reason why this technique works is that these moves are often unsustainable. They are generated by some sheer excitement following a news release or similar. Once the initial enthusiasm evaporates, the price tends to normalize, which creates the opportunity to fade.
When fading a move, use a wider stop-loss to avoid getting whipsawed out of your position. In addition, don’t try to fade strongly trending markets, because you’ll get hammered.
Enter the Trend Using a Channel Pullback
No matter how strong a trend is, there will always be consolidations or pullbacks. It happens with every trend.
The good thing is that pullbacks are one of the most robust and profitable patterns. It’s statistically proven that they have a strong edge for both buys and sells across different asset classes.
With that said, let’s see how you can join trends using channel pullbacks. This strategy is typically used with envelope channels, so we’re going to use the Bollinger bands.
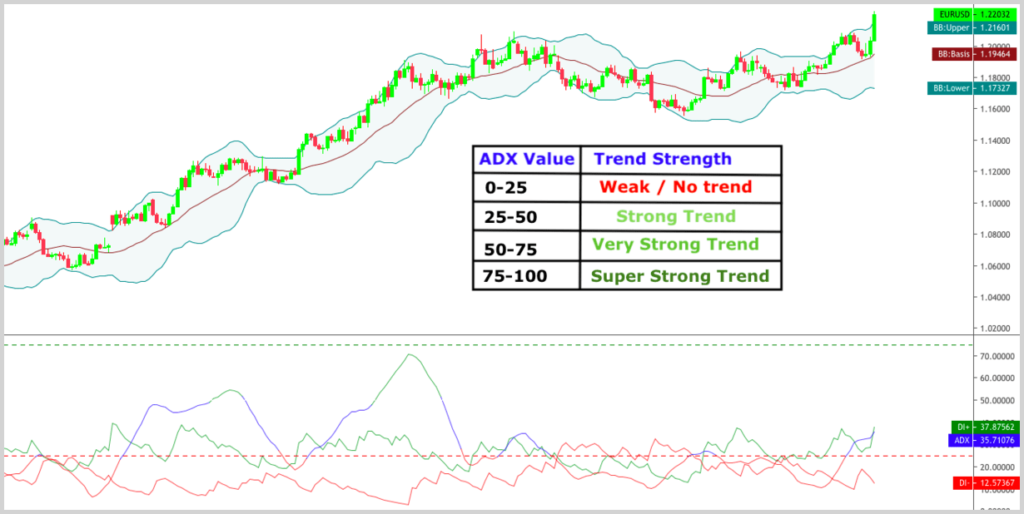
Step 1: Have a healthy trend.
First, it’s essential to ensure you have a healthy trend. Usually, an “eyeball test” will do the job, but you can also use tools like the ADX indicator.
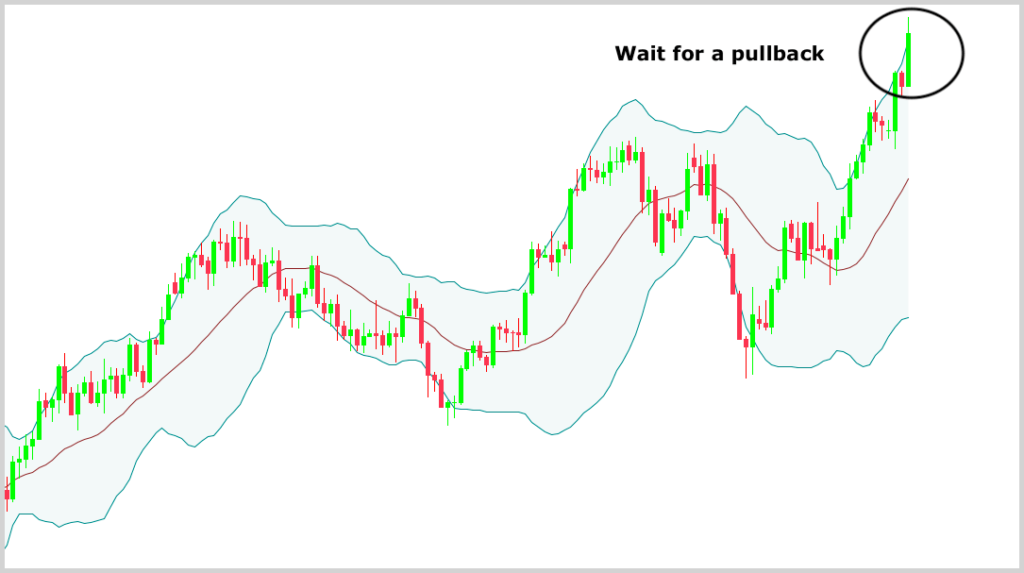
Step 2: Look for touches or excursions outside the channel.
Some traders use Bollinger bands to buy when the price breaks the upper band and sell when the price breaks the lower band. Unfortunately, this method sidesteps much of the usefulness of the indicator.
While it makes sense that you would feel more comfortable when the price is moving in the trend direction, you must remember that trends don’t move in straight lines. By the time you join the trend, consolidation might be on the way.
That’s why it’s better to treat the bands like an alert level. Once a touch or excursion happens, wait for a pullback to the middle of the channel.
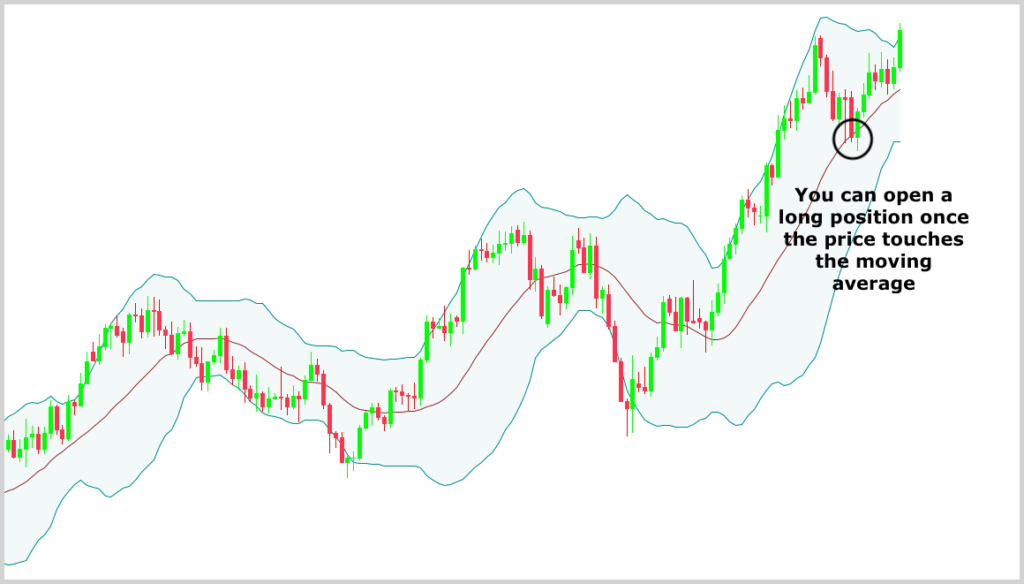
Step 3: Enter the market on a pullback.
Here’s the plan: You enter in the trend direction after a pullback. You get a nice discount and then see your profits grow as the trend progresses.
Sound good? Well, the reality is a bit more complicated.
Once a pullback is happening, you’ll be presented with the issue of uncertainty. Like it or not, there’s no way you can predict with 100% certainty where the pullback will end (if it will end in the first place).
The good thing is that you don’t even have to. Small edges will go a long way in the world of forex.
One edge is already there: You trade in the path of least resistance. But there’s another edge which you get by a proper entry.
What do we mean by that?
There are certain areas where a pullback may end with a higher likelihood. By entering at support and resistance zones, significant moving averages or Fibonacci retracement levels, you increase your chances of a profitable trade.
If you haven’t heard about the Fibonacci retracements tool, download our free PDF below:
Conclusion
There is massive interest in different technical analysis tools.
When you’re rapidly growing your trading knowledge, you don’t want to miss the concept of forex channels.
We’re not suggesting that you should go out and start trading channels from scratch without any backtesting or previous experience. There’s really no reason for that.
However, you should have a basic understanding of what channels are, their types, and ways to incorporate them into your strategy. The more tools you know about, the more likely you’ll find something that works for you.
Here’s what we suggest. Use a demo account to practice the things you have learned. Go through some charts and try to identify different trend channels. Then put on Bollinger bands and test the pullback strategy that we covered in this beginner guide.
That’s the best way to get your feet wet with channels if you don’t have any experience with them.