Blog
-
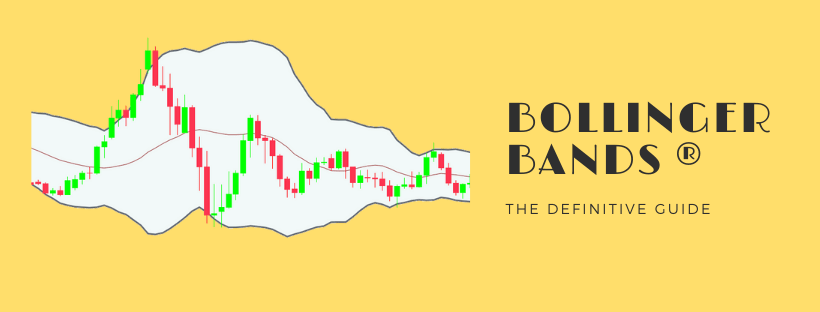
Bollinger Bands® have been one of the most popular technical tools for decades now. In this guide, we’ll teach you everything you need to know about this indicator. There’s a lot of content here, which is why we prepared a quick list so you can jump right into your area of interest: Bollinger Bands® Simple…
-
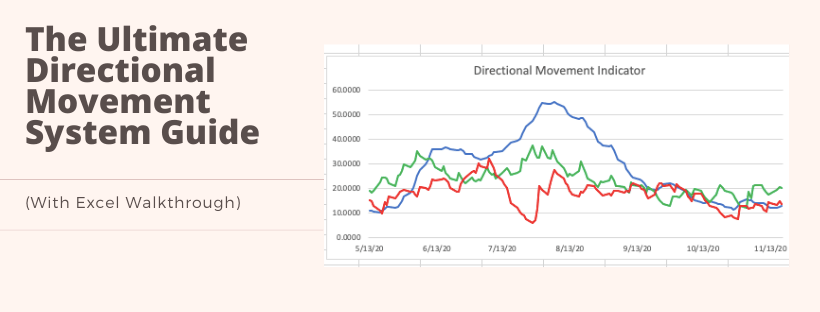
If you’re interested in defining the market condition, the directional movement system should be at the forefront of your mind. It’s a technical indicator that consists of three lines when plotted on a graph: The positive directional indicator (+DI) The negative directional indicator (–DI) The average directional movement index (ADX) When +DI is above –DI,…
-
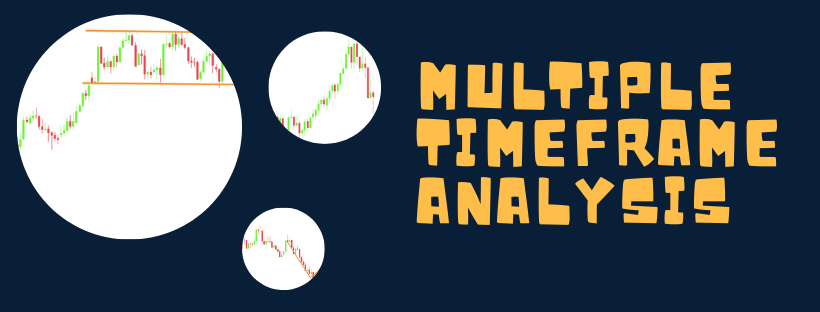
Multiple timeframe analysis is extremely popular. But what does it mean and how can you use it in your trading? The simple goal of multiple timeframe analysis is to find out what the market is doing at different time horizons and use it to your advantage to find better entry and exit points. This post…


