Welcome to our guide on the Average True Range (ATR) indicator!
Whether you’re a seasoned trader seeking to refine your strategies or a novice just stepping into the thrilling world of financial markets, the ATR indicator can help.
In this all-new guide, you’ll learn:
- What the ATR forex indicator is,
- How to calculate the ATR,
- The logic and purpose of ATR,
- How to use the ATR to set optimal stop losses, and
- ATR settings for different trading styles.
Let’s get started!
What is the ATR forex indicator?
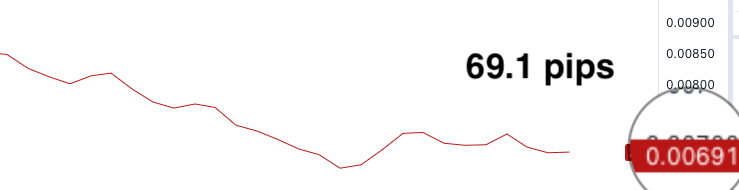
The Average True Range (ATR) is a simple tool used by forex traders to determine how much a currency pair tends to move.
For example, if the ATR shows 0.00691 for EUR/USD, this means that an average candle moves 0.00691 units or 69.1 pips.
This is measured over a series of candles that you can give to the indicator as an input parameter.
By default, the ATR indicator considers the most recent 14 candles on the active chart.
When the market experiences high volatility, you’ll notice larger candles on your chart and a higher ATR reading.
Trading during these periods can be riskier, but it is also when you can make the most money.
That’s why using a tool like the ATR can be advantageous. It helps you measure how volatile the market is and choose markets that align with your comfort level for taking risks.
In addition, you can use the ATR to calculate a good place for your stop loss. We will talk about this later in the guide.
How to Calculate the ATR
The ATR works with a concept called True Range.
The true range (TR) is the maximum value of the following three values:
- The difference between the current high and the current low.
- The difference between the previous close and the current high.
- The difference between the previous close and the current low.
In essence, it is a unique way to measure market volatility.
Instead of simply taking the difference between the high and the low of a candle, the TR calculation makes additional comparisons to consider possible market gaps.
Thereby it captures volatility more accurately.
The ATR is calculated by taking the average of a series of TR values:
ATR = (TR1 + TR2 + TR3 + … + TRn) / n
If you learn better by doing, we’ve got you covered.
Below is a step-by-step walkthrough for calculating the ATR in Excel:
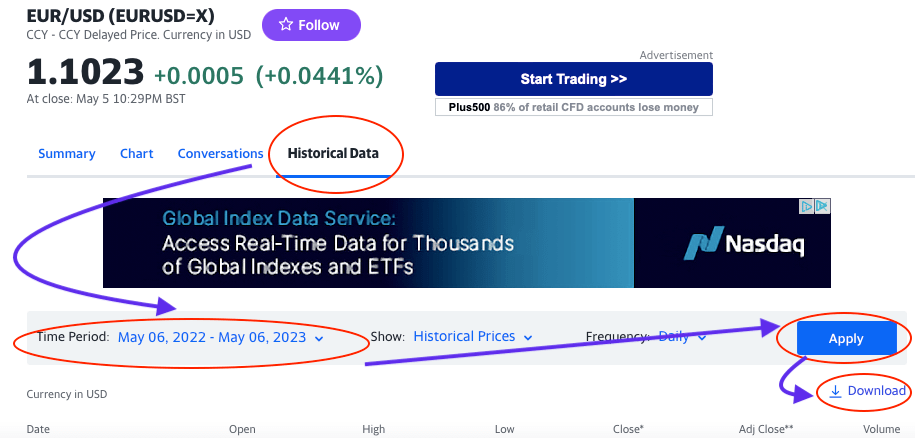
Step 1: Get sample data
Go to Yahoo Finance and type the ticket symbol of the currency pair you want to download historical data for into the search box.
Once the page has loaded, click the “Historical data tab” button.
Set the “Time Period” to one year, then click “Apply,” and then download using the blue link.
This article belongs to ForexSpringBoard.com Do NOT Copy
Step 2: Delete redundant Information
Delete the “Open,” “Adj Close,” and “Volume” columns.
Step 3: Calculate the True Range
As you might remember, the true range is the maximum value of the following three values:
- The difference between the current high and the current low.
- The difference between the previous close and the current high.
- The difference between the previous close and the current low.
So first, you will need to add a new column for each of these values.
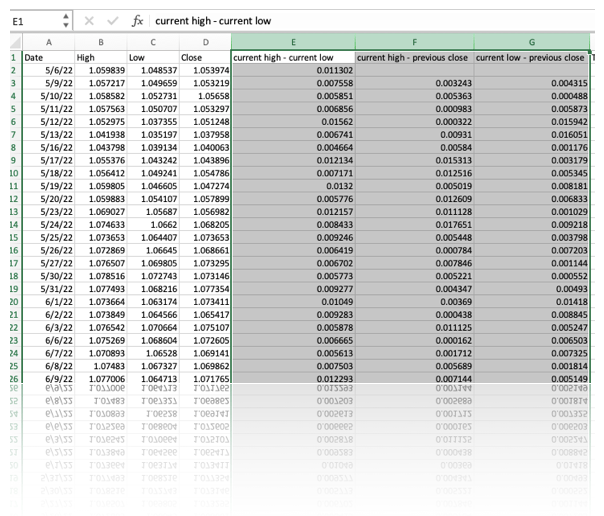
You won’t need any complicated formulas, only simple subtractions, as indicated by the column names.
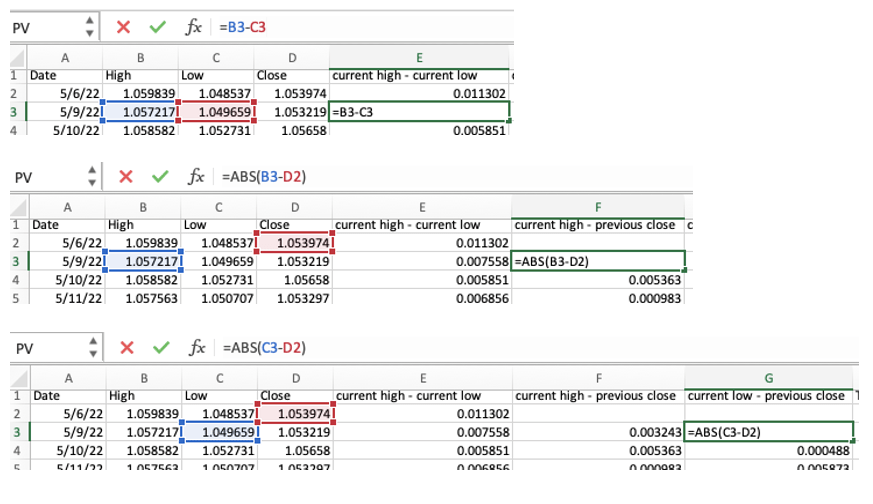
Note, however, that we use the absolute values because it makes no difference whether the price movement was up or down; we are only interested in the distance travelled.
Once you have the three data points, you can calculate the true range. Use the built-in Excel function MAX() with the range of values as a reference.
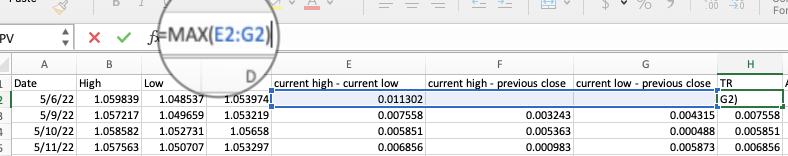

Step 4: Calculate the ATR
Finally, you can calculate the ATR by taking the average of the previously calculated TR values.
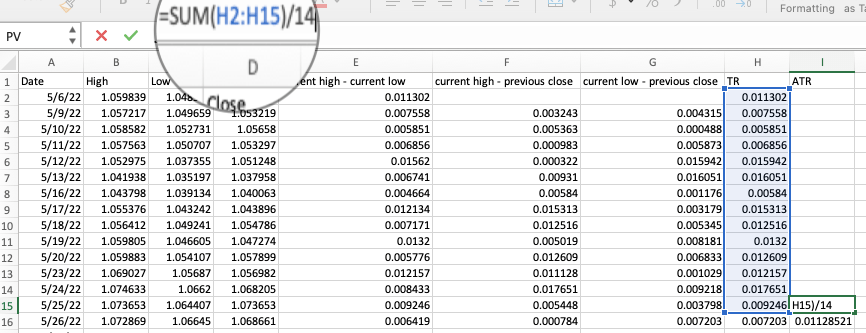
We’re looking at a 14-period average because that’s the default value for the indicator. But you can easily calculate the ATR for any other period as long as you have enough data.
Step 5: Plot the ATR
If you want to get a visual version of the indicator, just select the ATR column (from the first available value) and insert a line chart from the toolbar.
You can then compare your indicator to the one in your trading platform to see if you got the calculation right.
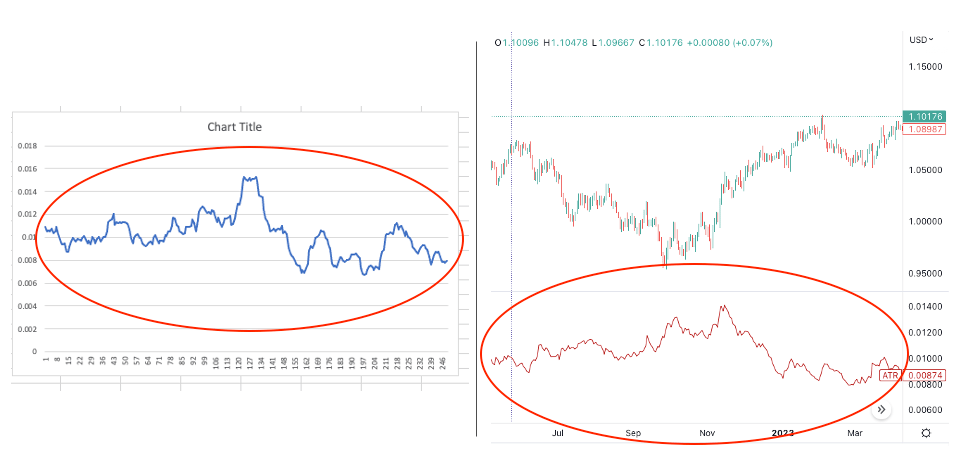
Note that different brokers can have slightly different exchange rates, but overall, you should get a similar ATR to what you see on trading platforms.
Understanding the Logic and Purpose of the ATR
So, we know that the ATR was designed to help traders get a handle on volatility.
Volatility is a conceptually simple thing to understand, but it is more difficult to measure objectively.
For example, if you have a very active market, it is easy to say that the volatility is high. But how you define volatility mathematically and incorporate it into your trading decisions is not that straightforward.
The purpose of the ATR is to provide a solution to this problem.
What Wilder observed is that range, or the distance the price move per increment of time, is directly proportional to volatility.
This simply means that if you have one candle (one unit of time), you can subtract the low from the high to get the range, which gives you an idea of how volatile the market is.
Now the caveat to this is that occasionally the price will gap up or gap down.
For instance, take a look at the below situation:
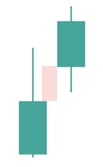
The second green candle opened higher than the first green candle closed.
(The difference is highlighted in red.)
In this case, calculating the volatility by subtracting the difference between the current high and the current low can lead to incorrect results.
In particular, when the low point is above the previous close, the actual distance moved will be underestimated.
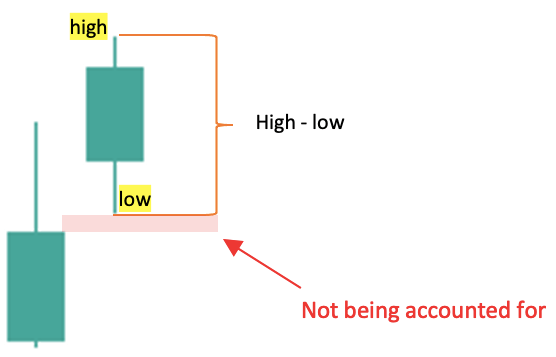
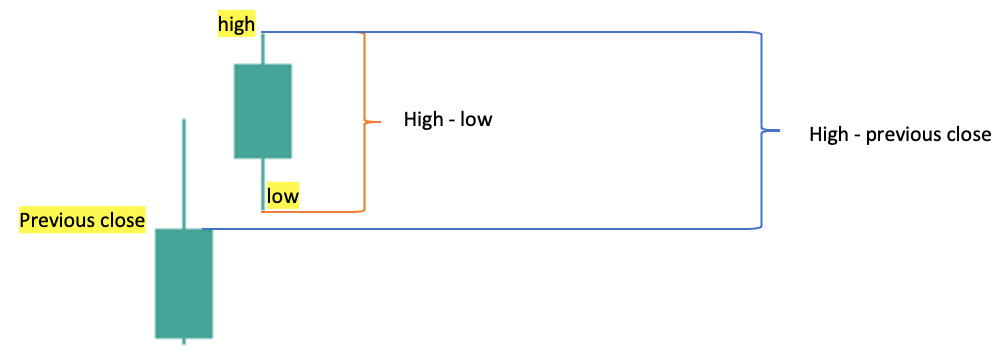
It is easy to see that the real distance moved in this case is the distance between the current high and the previous close. This captures volatility more precisely.
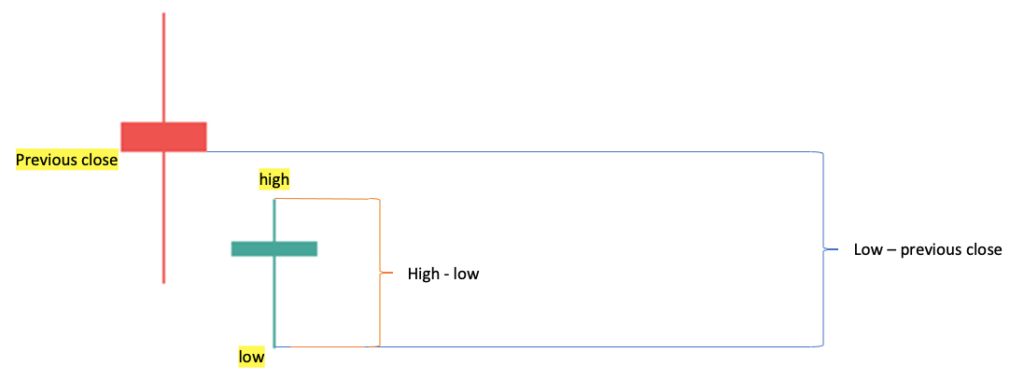
Similarly, when the market gaps down, we must also look at the difference between the current low and the previous close rather than just the difference between the current high and low.
You already know that the true range is always the maximum of
- The difference between the current high and the current low.
- The difference between the previous close and the current high.
- The difference between the previous close and the current low.
Now you also understand why.
Using the maximum of these three values ensures that we always use the most encompassing definition of volatility.
Wilder maintains that in order for range to be a meaningful tool as a measure of volatility, it must take into account more than one day’s range.
That is why a final calculation is performed: the average of the true ranges over a number of days, also known as the ATR.
So that’s pretty much the logic behind the indicator. It’s quite smart.
No wonder why the ATR is very popular for estimating the potential price movement of a currency pair.
And how can that help you in trading?
Keep on reading to find out…
Using the ATR to Set Optimal Stop Losses
Risk management is an important part of trading and the stop loss is an effective way to limit the damage the market can do to your account.
The only problem is that a stop loss which is placed incorrectly can put you out of an otherwise good trade and make you lose money even where you shouldn’t.
Since the ATR is a measure of market volatility, its most common application is to help calculate the ideal stop distance.
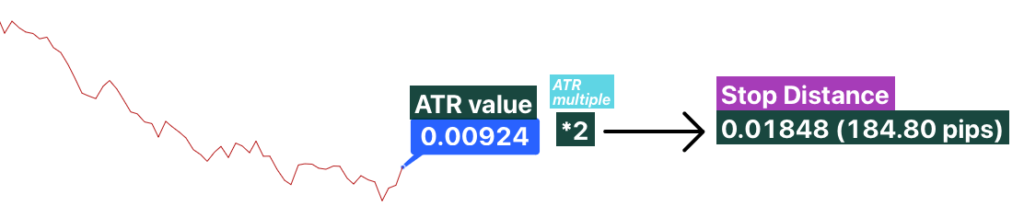
The way this works is that you take the ATR value and multiply it by a certain constant and add or subtract the resulting number from the entry price to get to your stop loss price.
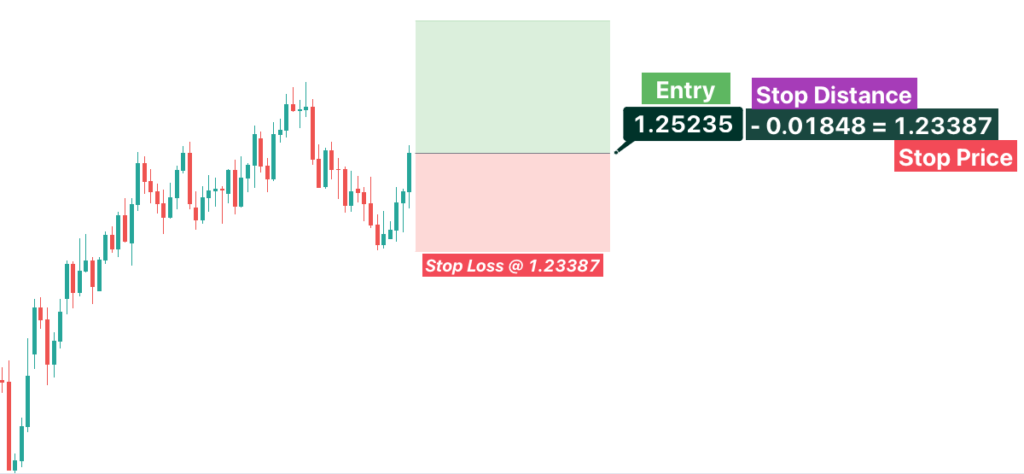
For instance, let’s say the market price is 1.25235 and the ATR shows 0.00924.
You might decide to use an ATR multiple of 2, which will give you a stop distance of 0.01848.
So, your stop for a long trade will be: 1.25235 – 0.01848 = 1.23387,
and for a short trade 1.25235 + 0.01848 = 1.27083.
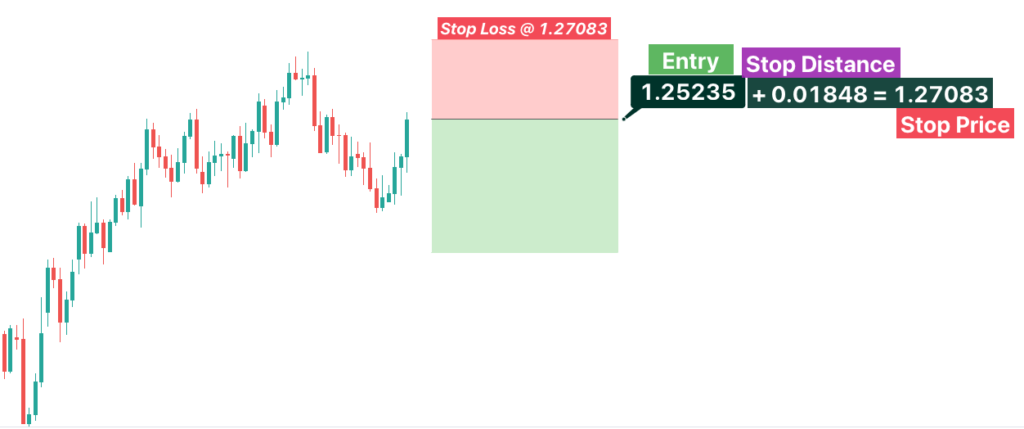
Simple as that.
This goal of this is to ensure that the stop loss is far enough not to be triggered by ordinary price moves.
In other words, you will only lose money if the market moves sharply against you, which is probably a situation where your idea was wrong anyway, and you want to get out of the trade.
The best ATR multiplier to use can also be somewhat dependent on your trading style. We will talk about this in the next section.
A more advanced technique regarding stop losses is to use the ATR for a trailing stop. This involves adjusting the stop loss based on changes in the ATR value.
So, when the market begins to move in your favor, you trail the stop after the price, ensuring that it always remains within the desired ATR multiple.
Traders who use a trailing stop usually don’t have a take profit order and instead rely on the stop loss to close the trade.
If the market moves in your favor and you continue to trail the stop, eventually the stop will be above the entry price, and stopping out will be equivalent to taking profit.
This is why the ATR trailing stop might be a good way to catch larger price movements while still having the necessary downside protection.
ATR Settings for Different Trading Styles
People trade in all sorts of ways.
Trading styles are broad categories used to differentiate between trading approaches based on their preferred timeframe.
Since the ATR period is entirely customizable, you can experiment to see what setting works best for you.
Here are some ideas that you can use as starting point:
Trading Style | Timeframe | ATR Period | ATR Multiplier |
Scalping | 1-minute or 5-minute charts | 5 or 10 | 1.0 or 1.5 |
Day Trading | 15-minute or 30-minute charts | 10 or 20 | 1.5 or 2.0 |
Swing Trading | 1-hour or 4-hour charts | 20 or 30 | 2.0 or 2.5 |
Position Trading | Daily or Weekly charts | 30 or 50 | 2.5 or 3.0 |
Feel free to test and adjust the above settings based on your needs.
Conclusion
The ATR (unlike many other indicators) does not generate trading signals or tell you whether to buy or sell.
Instead, it displays the average movement of the currency pair.
Depending on whether you prefer active or slower moving markets, this can help you decide which currency pairs to trade and which to avoid. Furthermore, you can use the indicator to set your stop losses.
This way, instead of having an arbitrary stop distance, you will incorporate market volatility into your decisions, making it less likely that you will lose money due to market noise.