In this guide, we share with you a winning Stochastic Oscillator strategy for forex.
Of course, this is not an invitation to trade this strategy, as, by the time you read this guide, it might have already lost its edge.
However, the fact that it was profitable during the two years we backtested it is interesting enough to merit creating a guide about it.
Make sure to read this guide because we will explain the strategy in detail.
What Is the Stochastic Oscillator and How Does It Work?
Because this is a Stochastic Oscillator strategy, it makes sense to devote a few words to this indicator so that we all understand how it works.
The Stochastic Oscillator is a technical indicator that compares closing prices to a price range over a given period.
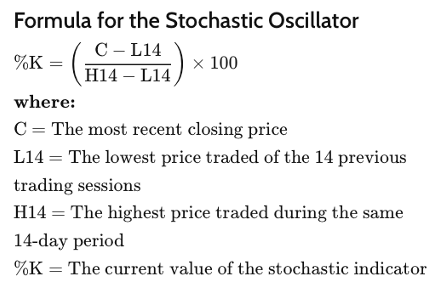
The exact formula looks like this:
(Courtesy of Investopedia)
We dare to share it only because, as you can see, it is not particularly complicated. With the help of some basic elementary school math, you can easily calculate the indicator yourself.
Let’s take a look at an example.
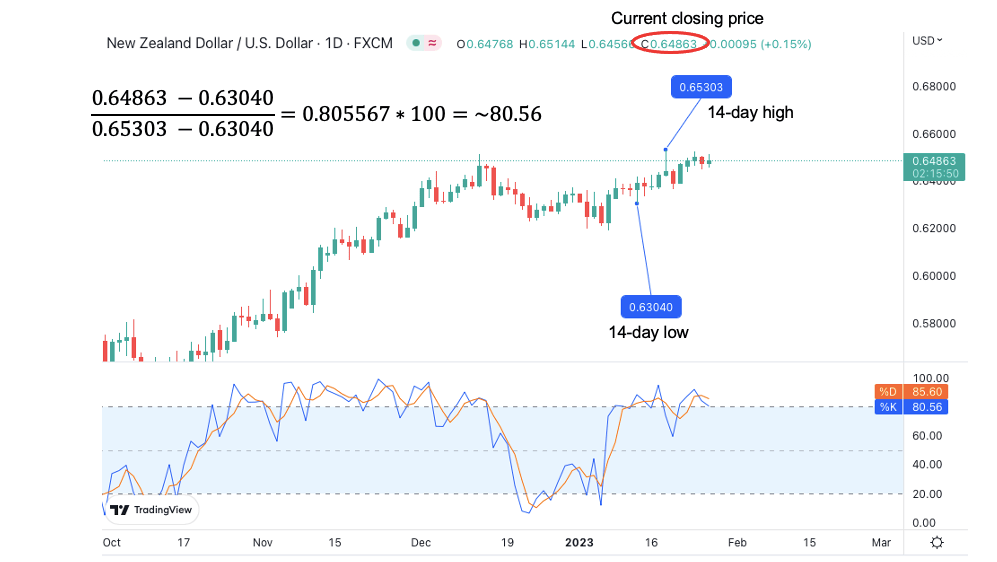
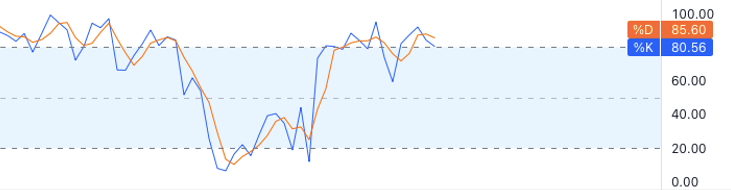
We start with the current closing price of 0.64863 and subtract 0.63040 – the lowest price over the last 14 candles. This gives us number X. Then we take 0.65303, the highest price over the same 14 candles, and subtract the lowest price from that. This gives us number Y.
Finally, we divide X by Y to get %K, which is the value of the Stochastic Oscillator. You can convert it to a percentage by multiplying it by 100. This way, you’ll get the same result as shown in the indicator pane.
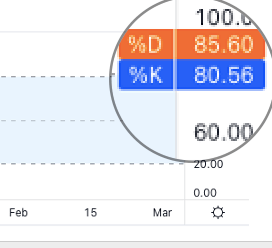
(%D is the three-day simple moving average of the stochastics.)
In essence, number X (current close – lowest low) measures the strength of buyers or sellers. This is because it reveals how far buyers could raise the price from its low or how far sellers could push it even lower.
The Y value (highest high – lowest low) is simply the trading range.
When we divide these two values by each other, we can show how far the price has moved relative to its range and in which direction.
This is represented in the indicator window as a line that oscillates between 0 and 100 – hence, the name “oscillator.” The term “stochastics” is used in statistics to describe things that have random variables.
Combine these two and you get the name Stochastic Oscillator – an indicator that oscillates based on random price swings.
The usefulness of the Stochastic Oscillator is based on the concept of mean reversion.
This states that even if prices are random, they have the propensity to return to their mean values. We may predict when these reversions will occur by identifying overbought and oversold situations.
In the case of the Stochasic, values above 80 are typically regarded as overbought, while values below 20 are considered oversold. At these levels, the price deviated from its mean so much that it is likely to normalize and retrace a bit.
This is the logic upon which this and similar strategies are built.
Okay, by now, you know everything you need to know to understand our Stochastic Oscillator forex strategy. It’s time to get into the details.
Stochastic Oscillator Strategy for Forex
The good thing about mean reversion-based strategies is that they can work in bothtrending and ranging markets.
This is because the price can get overbought or oversold in both strong trends and sideways markets.
It is important to note that we are not talking about these extremes in the sense that the price is so high or low that it doesn’t make sense compared to fundamentals or your judgment of what’s normal.
By these standards, you could easily find markets that stay overbought/oversold for months.
We are looking for situations in which the price gets too overextended in one direction – for example, when the next leg of an uptrend turns into an extended rally and you see a series of green candles with no retracement.
The market might continue to trend or do whatever it does after retracing a bit (so it might remain overbought in the grand scheme of things) but the key is exactly this small retracement, which will eventually come when the price is pushed too far in one direction.
Time Frame
The Stochastic Oscillator strategy works with the 1-hour (H1) chart. This means that signals are monitored and trades are entered into the 1-hour chart, where each candle represents 1 hour of price movement.
Indicators
- Stochastics Oscillator (5,3,3)
- Simple Moving Average (100)
The moving average is used as a filter and is applied to daily data.
Currency Pairs
We have data to prove that this strategy worked for EUR/USD in the past. So, while we can’t vouch for other currency pairs, nothing is preventing you from experimenting.
Strategy Concept
We’ll be watching for instances in which the Stochastic Oscillator exits the overbought state and begins to fall or when it exits the oversold state and begins to rise.
Essentially, this is when %K crosses the 80 line from above or the 20 line from below.
Remember that when the indicator stays in either of the two extremes, the market is prone to a correction. When the indicator departs from the extreme territory, we get a signal that the correction might begin.
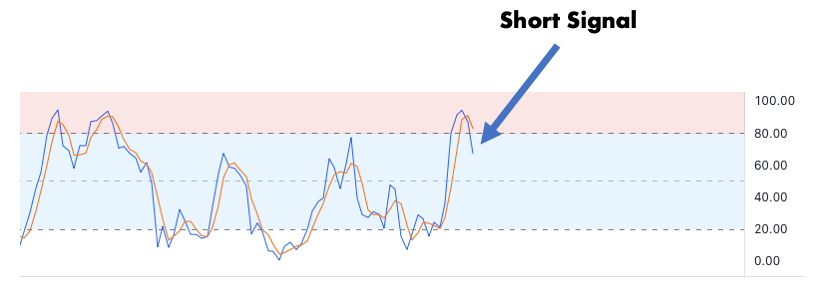
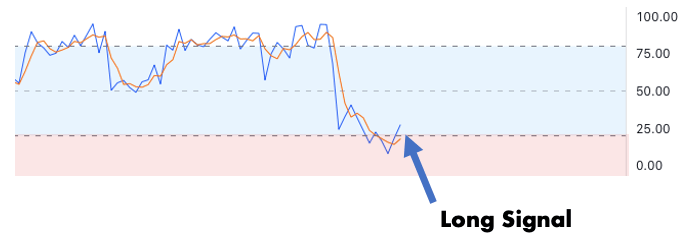
The goal of this strategy is to grab a few pips each time the market retraces after a large move. You want to enter a short position when the stochastic falls below 80…
…and a long position when it rises above 20.

This article belongs to ForexSpringBoard.com. Do NOT copy.
We will have a wide stop loss and a tight take profit.
This takes advantage of the idea that the market has reached its limit and is unlikely to continue moving in the same direction for much longer.
Even if we can’t catch the exact turning point, by using a wide stop, we can accommodate some unfavorable price action before the market moves our way, and we can exit at a small profit.
The strength of this strategy is its high win rate. It will win most of its trades but the occasional losers will be a lot bigger compared to the frequent but small wins.
Still, the psychological benefit of winning most of your trades is huge. Also, despite the bigger losses, the strategy can be highly profitable, as evidenced by the backtest results.
Long Trade Setup
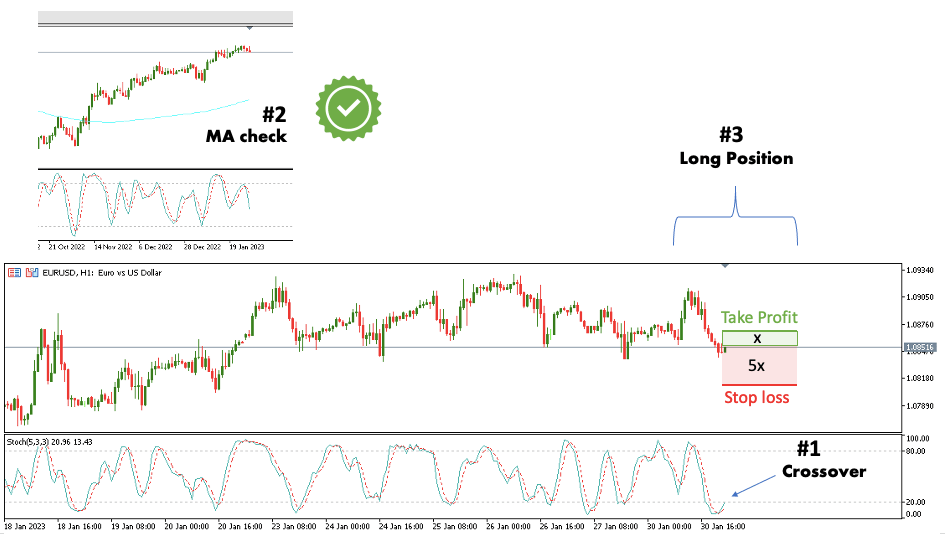
We use the EUR/USD on a 1-hour timeframe to illustrate a long trade.
As described earlier, we will use two indicators: the Stochastic Oscillator and the Simple Moving Average.
The signal for the long trade occurs when the Stochastic Oscillator crosses the 20 level from below.
If this happens, you should first check if the price is above the 100-period daily moving average. We will ignore the signal if it is not, as we want to increase our chances of winning by trading in line with the long-term trend.
What’s a bit tricky is that you can’t use the daily moving average on the hourly chart because each time you switch charts, MetaTrader recalculates the indicator with data from the currently active chart.
Because you are trading the hourly chart, you are not in a rush, so you can simply cross-check with the daily chart to see if the price is above the moving average before opening a trade.
(Or, if you use our trading robot, it will automatically filter trading signals using the daily MA no matter which timeframe you are looking at.)
So, if the price passes the moving average check, you can proceed with a long trade.
Place your stop loss 50 pips below the entry price and your take profit 10 pips above.
That’s pretty much it. This is how you trade a long signal with this Stochastic Oscillator strategy.
Short Trade Setup
We use the same 1-hour chart and EUR/USD currency pair as before.
This time, we wait for the stochastic to cross the 80 level from above while the price is below the 100-period daily moving average.
If these two conditions are fulfilled, you can open a short trade. The stop should be 50 pips above the entry price and the take profit should be 10 pips below.
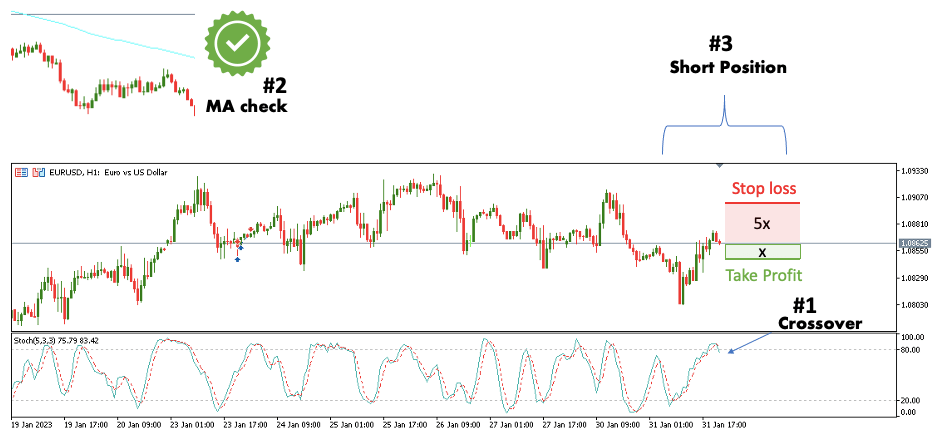
This is pretty much the same as with the long trade, just in reverse.
Now that you know how this strategy works, it’s time to look at its performance. For that, we tested it on two years of past prices. Continue reading to find out what happened.
Backtest Results
Here are the complete backtest results:

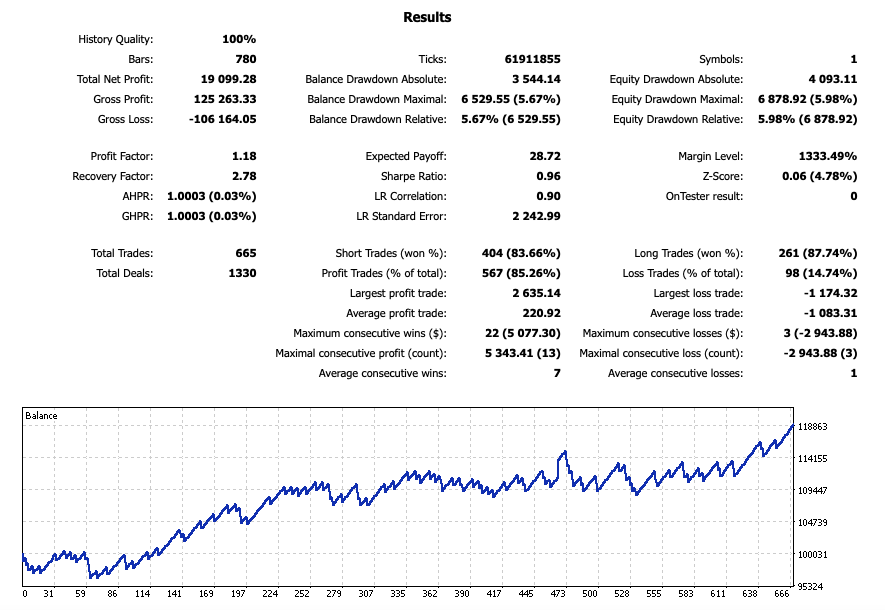
The numbers tell you everything, so let us take note of only a few minor details, one of which is the 85.26%-win rate.
Though the average winner is only $220.92 vs. the average loser, which is $1,083.31, winning most trades feels good and will give you a psychological edge.
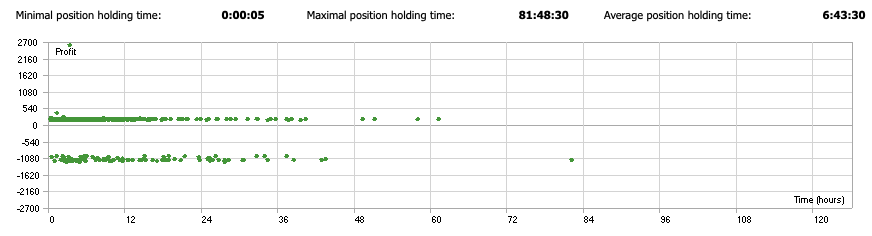
Talking about the average win, you might notice that the largest win is surprisingly high ($2,635.14) despite the low risk-to-reward ratio trades.
This is because this trade stayed open during the weekend and there was a large weekend gap.
We were lucky in this situation because the market gapped above the TP; therefore, the position was not closed at the TP but at a much better price. However, keep in mind that gaps can also hurt you.
In our forex gap guide, we explain that one way to mitigate gap risk is to simply close every trade before the weekend. This is something we didn’t do here but it can be a good idea if you want to play it safe.
Despite the fact that this risk was kept open, the strategy performed great. Drawdowns were minor and we ended the test with about 18% in profit.
At this point, it’s worth noting that we risked 1% of the account on each trade during the backtest. If we had risked 2%, 3%, or even 5%, the profit would have been 2x, 3x, or 5x higher. However, the risk would have also increased considerably.
Conclusion
The purpose of this guide was not so much to give you a trading strategy but to show you what it looks like to design a winning trading strategy.
The market changes all the time and what worked in the past might stop working in the future.
Instead of relying on someone else’s strategy, it is always preferable to create your own strategies, as this gives you the most flexibility.
Of course, you don’t have to reinvent the wheel. Feel free to take inspiration from guides like this. We hope you enjoyed reading it and that it will help you get one step closer to your goals.