
A forex rectangle pattern might appear on your chart when a trending market slows down and begins to consolidate. Simply put, rectangles represent sideways price movement.
They are one of the most frequently occurring chart patterns.
Given this, it’s critical to understand what they mean and to have strategies in place to profit from their formation.
If you’re new to the subject, this rectangle patterns forex guide will undoubtedly benefit you.
We gathered everything you need to know and organized it in an easy-to-understand format so you can learn everything about forex rectangle patterns in one place.
Let’s dive in.
What Is a Rectangle Pattern in Forex?
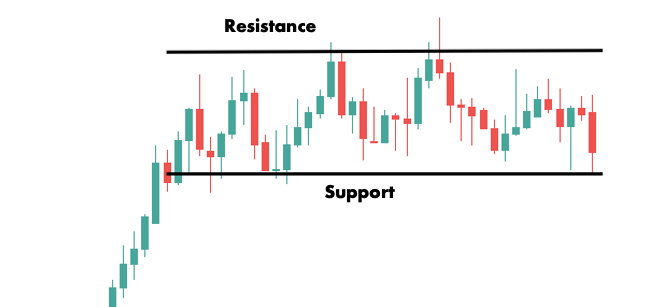
The forex rectangle pattern is a chart pattern that occurs when the price is bouncing between two parallel support and resistance levels.
Understanding support and resistance is critical to trading chart patterns like the rectangle. If you’re unsure, start by reading our guide on the subject.
They are important areas on the chart that seem to act as a barrier for the price. In other words, the market often turned around in the past when reaching these price levels.
When a forex rectangle occurs, the price is stuck inside a zone bounded at the bottom by a support level and at the top by a resistance level.
This denotes a period of equilibrium in which neither buyers nor sellers can significantly move the price in their favor.

Once a breakout occurs, the price can trend in the direction of the breakout, whether to the upside or the downside.
From trading the bounces within the pattern to looking for breakouts or positioning for the subsequent trend, there are many different techniques you can use to trade rectangles.
We’ll go over these later in this rectangle patterns forex guide. For now, let’s take a closer look at the different types of this pattern.
Rectangle Pattern Types – Bullish and Bearish Rectangles
Broadly speaking, there are two types of forex rectangle patterns: bullish and bearish.
In terms of appearance, bullish and bearish rectangles are the same. It is how they fit into the larger market structure that determines their implications.
If you’re hearing this for the first time, it might be confusing, but don’t worry; we’ll break it down so that it makes perfect sense.
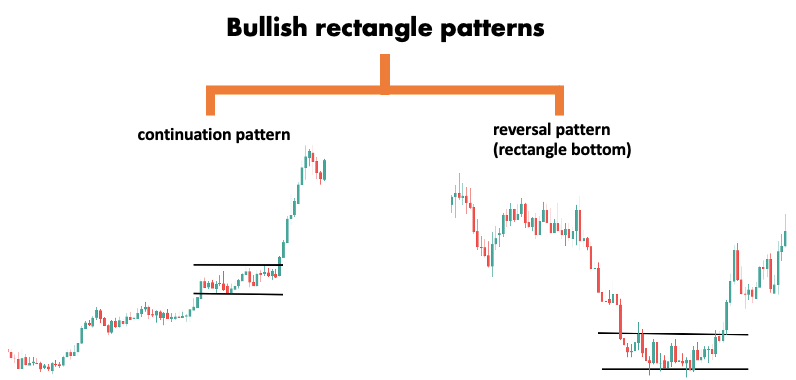
The bullish rectangle has a breakout to the upside, indicating that prices will rise. So, if prices have already been rising, as in an uptrend, the bullish rectangle is a continuation pattern.
However, if prices are falling, the bullish rectangle indicates that the market has reached its bottom and is about to reverse. That’s why it is also called a rectangle bottom in this case.
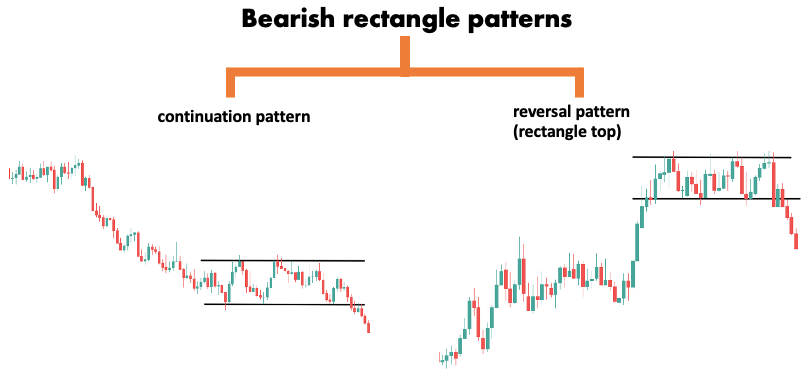
Similarly, the bearish rectangle has a breakout to the downside, indicating that prices will fall.
So, in a downtrend, where prices have already been falling, the bearish rectangle is a continuation pattern.
In an uptrend, however, it signals that the trend has reached its top and is about to reverse.
The table below offers a summary:
| Trend | Breakout Direction | Rectangle Bias |
|---|---|---|
| Up | Up | Bullish continuation |
| Down | Up | Bullish reversal |
| Down | Down | Bearish continuation |
| Up | Down | Bearish reversal |
Now we’ll take a closer look at each type of forex rectangle pattern.
Bullish rectangle continuation pattern
The bullish rectangle forex pattern functions as a continuation pattern when it occurs in an uptrend and the breakout happens to the upside.
To better understand, let’s go over the formation of the pattern.
What would you do if you had invested in something a long time ago and its price had been rising since then? You’d probably think about selling to make a profit, right?
It’s only natural that those who bought the currency pair at the start of the trend will take profit at some point. As the number of sellers increases, however, the market will struggle to advance.
This produces the resistance level visible at the top of the bullish rectangle.
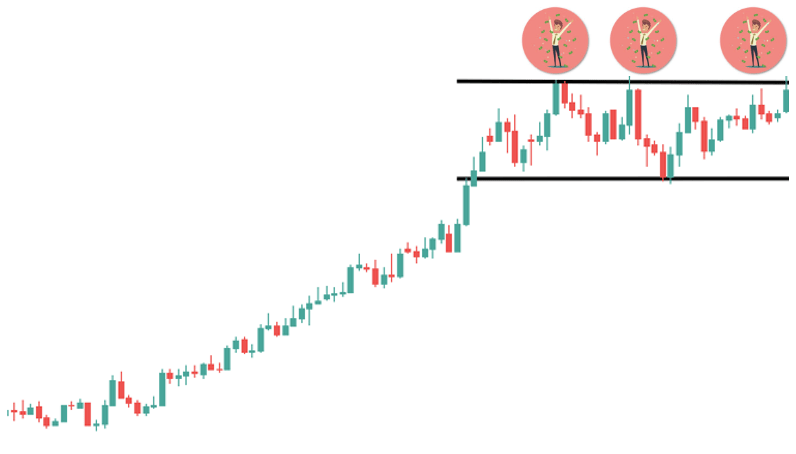
When the market finally falls, other traders take advantage of the opportunity to buy at a lower price. Perhaps they missed out on the initial move or they just want to add to their position at a lower price.
Either way, you see that there is demand at a specific level. This is where the support level emerges, forming the rectangle’s bottom.
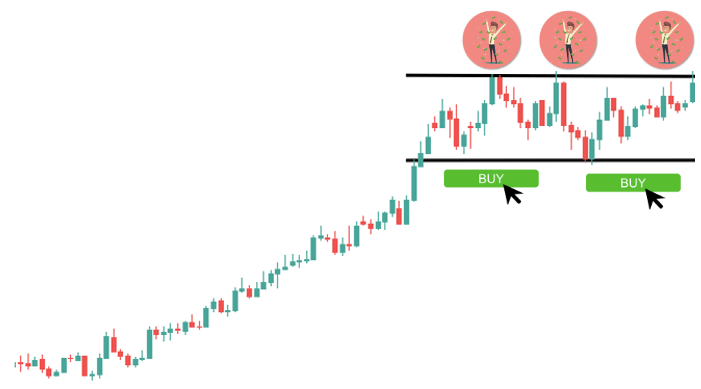
The market is currently trapped between two levels: support at the bottom and resistance at the top. This is the classic definition of the forex rectangle pattern.
Sellers who think the trend is over will stop the price from moving above the resistance. Similarly, buyers who think there’s still room for an increase will stop it from falling below support.
When a breakout occurs to the upside, the market tells you that the profit-taking is done, and short-sellers were unable to hold the resistance. The odds now shift in favor of trend continuation.
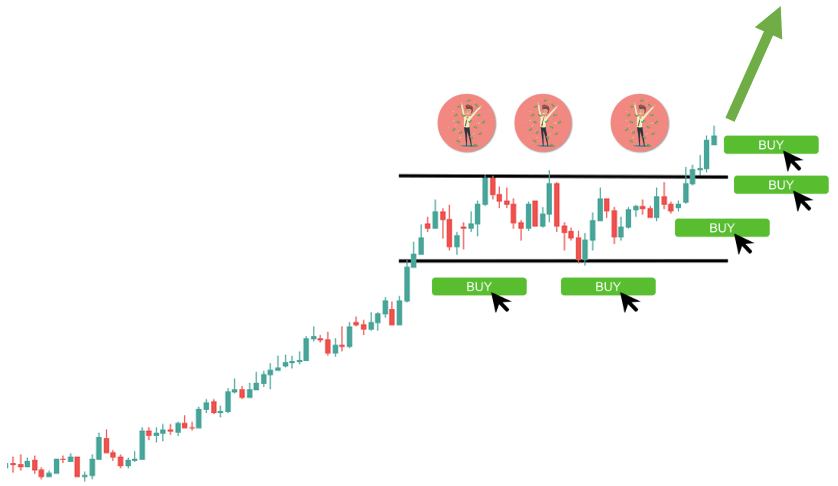
This explains why the bullish rectangle is a continuation pattern if it is located in an uptrend.
Bullish rectangle reversal pattern (rectangle bottom)
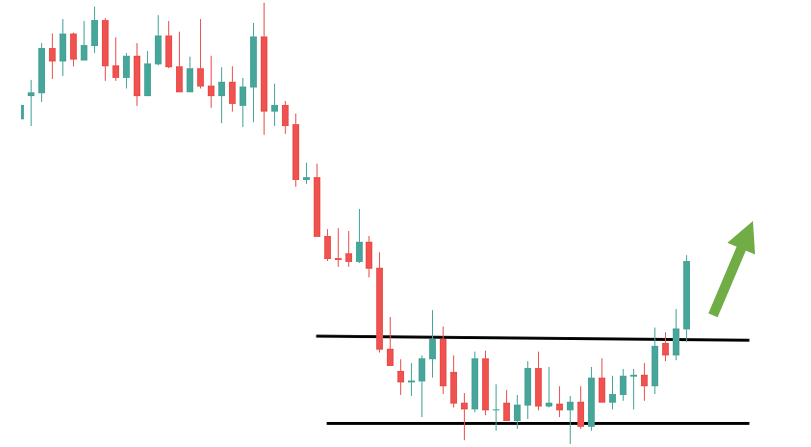
The bullish rectangle forex pattern functions as a reversal pattern when it occurs in a downtrend and the breakout happens to the upside. This formation is also sometimes referred to as the rectangle bottom.
Let’s take a closer look.
The market is downtrending when it suddenly begins to experience increased demand at a certain level.
This demand comes from bullish traders drawn in by lower prices and short sellers who have reached their profit target and are now closing their trades.
(Short sellers had to borrow the currency from their broker to sell it on the market. When they want to close their positions, they must repurchase the currency so that they can return it to the broker.)

The price starts bouncing between two levels: the support zone at the bottom and a newly established resistance at the top. This resistance is the hallmark of the seller’s intention to keep the market in the downtrend.
Because the trend is down, you’d expect a breakout to the downside. When the breakout happens to the upside, however, it’s a great indication of surging demand and a potential trend change.
Bearish rectangle continuation pattern
The bearish rectangle pattern functions as a continuation pattern when it occurs in a downtrend and the breakout happens to the downside.
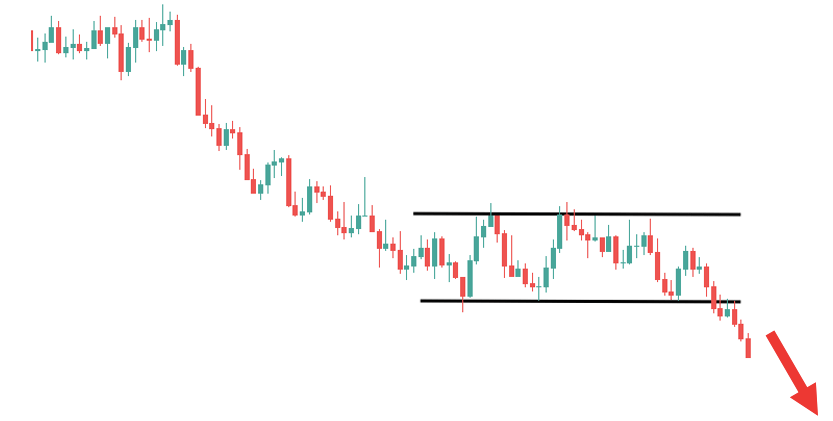
The price falls in a strong downtrend and then starts to consolidate between support and resistance levels.
The situation is identical to what we discussed earlier. The consolidation marks a period of equilibrium when neither buyers nor sellers are stronger than the other party.
This up-down struggle continues for a while and the pattern begins to exhibit the shape of a rectangle.
Eventually, buyers run out of ammunition. The selling overwhelms demand, and the price begins falling once again. When it breaks through the support level, the bearish rectangle is complete and signals a continuation of the trend.
Bearish rectangle reversal pattern (rectangle top)
The bearish rectangle pattern functions as a reversal pattern when it occurs in an uptrend and the breakout happens to the downside. This formation is also sometimes referred to as the rectangle top.
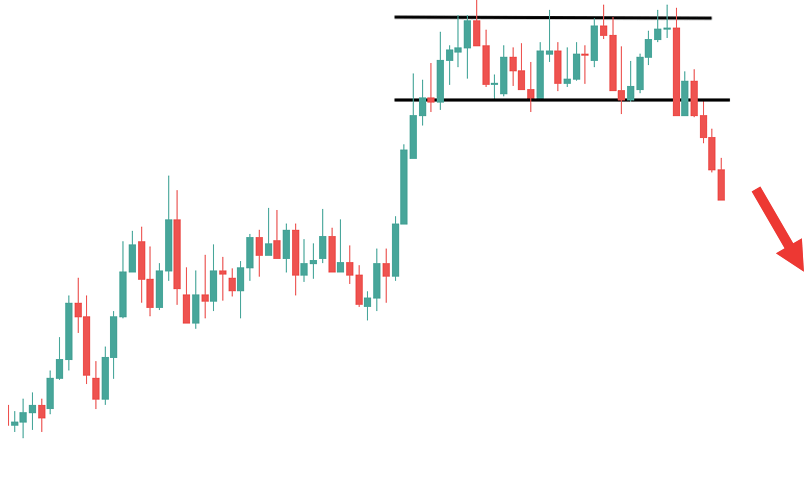
The rectangle top occurs when the uptrend enters a temporary sideways movement. It usually happens at or near an existing resistance level that the price can’t immediately surpass.
Around this area, the power of sellers and buyers becomes nearly equal. As a result, the price moves in a tight trading range, bounded by a resistance level at the top and a support level at the bottom.
Sellers take control after some time and the pattern completes with a downside breakout.
This is the distinguishing feature of the bearish rectangle reversal pattern: consolidation in the uptrend followed by a breakout to the downside signaling the reversal of the trend.
How to Trade Forex Rectangle Patterns
We’ve already hinted at the fact that rectangle patterns can be traded in a variety of ways.
In this section, we’ll review the most popular trading strategies.
First, we’ll take a look at a basic range trading strategy. This is ideal for new traders because it is simple to use and comprehend.
Then, we’ll turn our attention to more advanced techniques.
Trade Ranging Markets Using the Forex Rectangle Pattern
Instead of attempting to predict the breakout direction, you can simply decide to trade the bounces within the rectangle.
The advantage of this strategy is that you don’t have to worry about the type of rectangle.
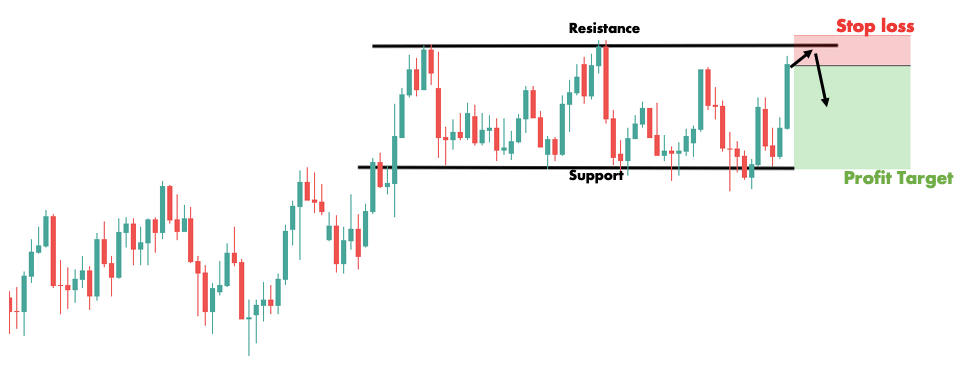
You simply recognize that the market is in a sideways range and trade accordingly. When the price reaches the resistance level, you sell and when it reaches the support level, you buy.
In the case of a buy order, the stop loss is set just below the support level, and the profit target is set on the opposite side of the rectangle.
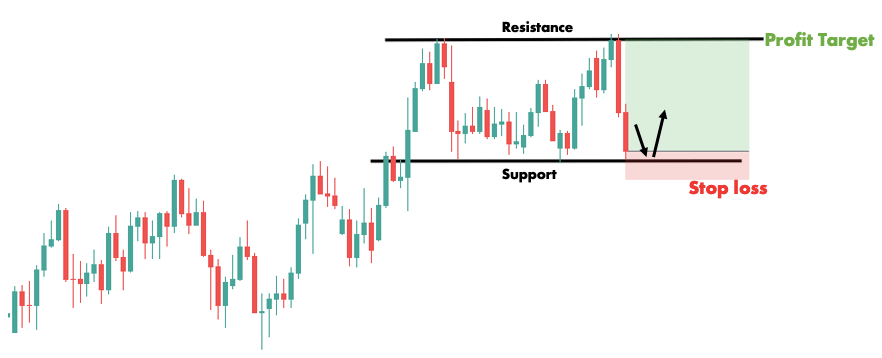
The guidelines are the reverse in case of a sell order.
Note that this strategy might not work well if the rectangle is very short.
In this case, you can either pass or look at the rectangle from a smaller timeframe where it will appear taller.
Of course, looking at the same pattern from a smaller chart will not actually make it taller, but by using the price structure on the smaller chart, you might set your stop at a closer distance.
This will allow you to open a larger position and earn more money per pip. As a result, even if the range is relatively short on a high chart, you might find it worthwhile to trade it on the low chart.
You now have a basic strategy for trading forex rectangle patterns. Let’s take a look at more advanced techniques.
Rectangle Patterns Forex Breakout Strategy
The rectangle breakout strategy involves waiting for either the support or resistance level to break and then taking a trade in the position of the breakout.
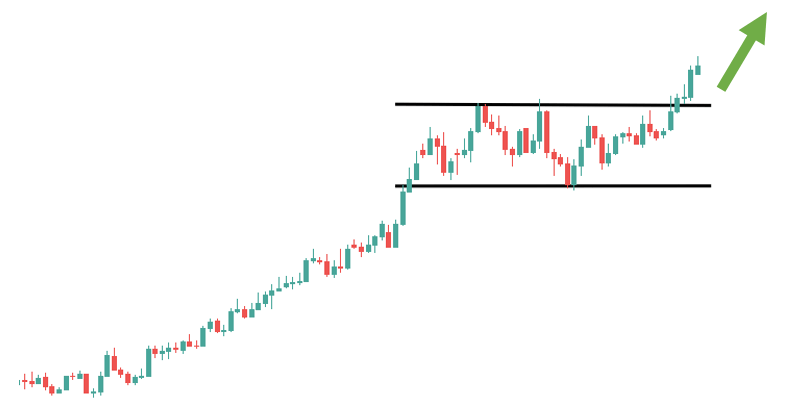
First, let’s see how it works with bullish rectangle continuation patterns and rectangle bottoms – the two types of rectangle patterns involving an upward breakout.
Before trading in the direction of the breakout, wait for the price to close outside the resistance line. The final candle must be a strong bullish candle; otherwise, the possibility of a false breakout is high.
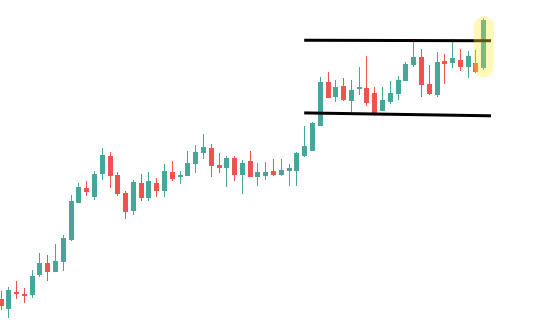
As you can see above, the breakout candle was quite large and closed close to its high. This satisfies the definition of a strong bullish candle.
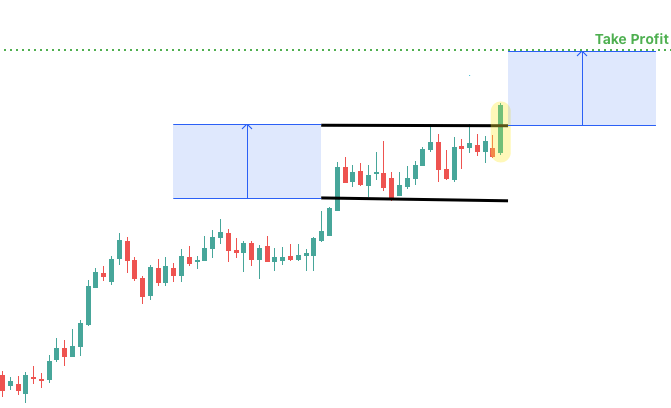
To calculate the profit target, you must measure the height of the pattern. Then simply add it to the value of the resistance line to get the upward breakout target.
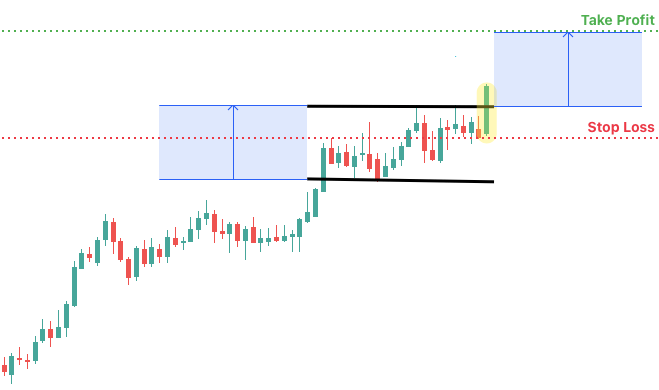
You can place the stop loss within the forex rectangle. If you want to be more aggressive, set it a few pips below the breakout’s low, just under the resistance level.
Otherwise, you can give your trade a little more breathing room by placing your stop on the other side of the rectangle, below the support level.
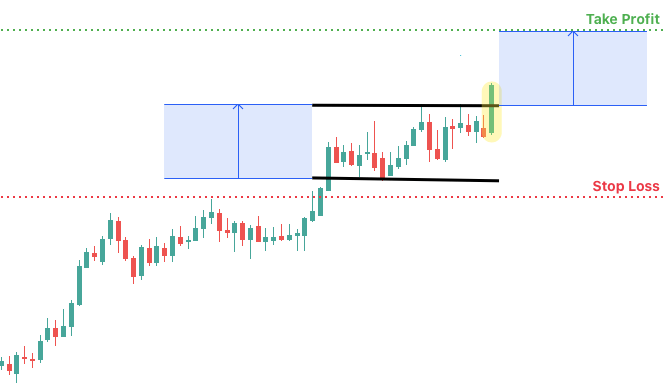
The advantage of a tighter stop is that it results in more reward per unit of risk. The trade-off is that it is expected to lower your win rate because you are more likely to be stopped out.
Now let’s take a look at rectangles that have a downward breakout, specifically, the bearish rectangle continuation and rectangle top patterns.
In this case, the first step is to wait for the price to close outside the support line. As before, you want to see conviction behind the move, but this time it’s represented by a strong bearish candle that closes near its low.
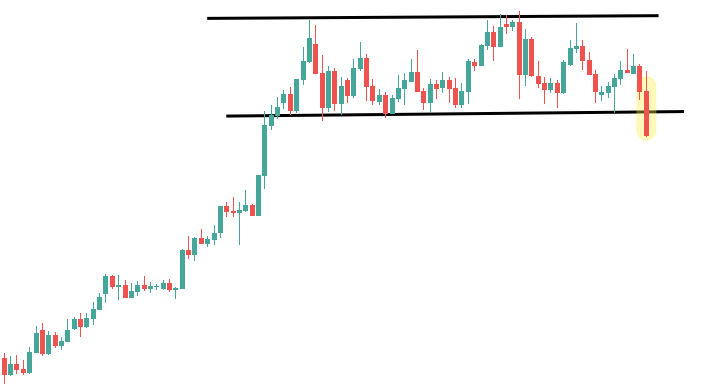
When this occurs, you should prepare for a short trade by calculating the profit target and stop loss.
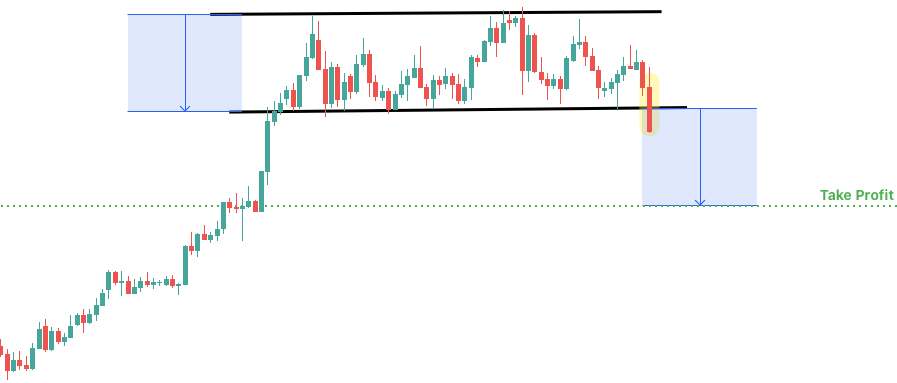
When it comes to the profit target, you must measure the pattern’s height just like before. This time, however, you must subtract it from the value of the support level to get the downward breakout target.
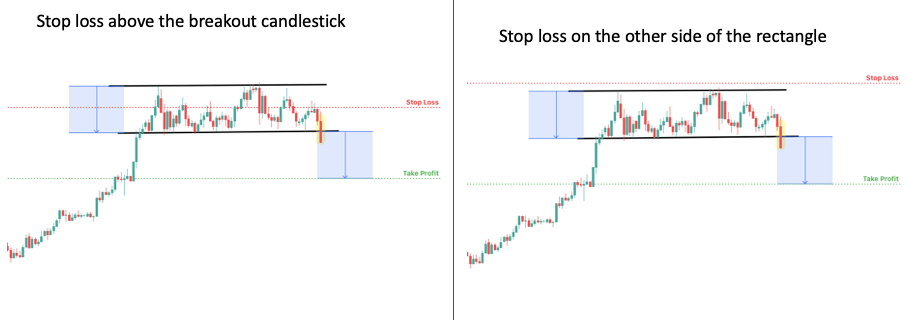
Depending on your risk tolerance, you can place the stop loss a few pips above the high of the breakout candle or a little above the resistance level on the other side of the rectangle.
Strategy for Contrarian Traders: Fading Breakouts from the Rectangle
In reality, support and resistance behave more like zones on a chart than precise levels. In retrospect, it’s always simple to adjust them so that you have clearly defined rectangle patterns.
When viewing the chart in real-time, however, it is more difficult to precisely time the beginning and end of the pattern as it is being shaped by the market.
A random price spike around support/resistance can easily lure you into a breakout trade.
The problem is that there is only one breakout, but there are many random spikes, which can cause significant losses by the time you finally catch the true breakout.
That’s why some traders take a different approach. Instead of betting on breakouts, they simply trade in the opposite direction. This is the essence of the contrarian trading strategy.
You sell when there is an upward breakout and buy when there is a downward breakout.
This strategy is usually supplemented with a technical indicator that helps to determine whether the market is oversold or overbought.
To illustrate, we’ll employ the Relative Strength Index.
The RSI ranges between 0 and 100. A reading of “50” indicates that the market is in balance. Anything less than 30 is oversold, and anything greater than 70 is overbought.
The strategy is the following:
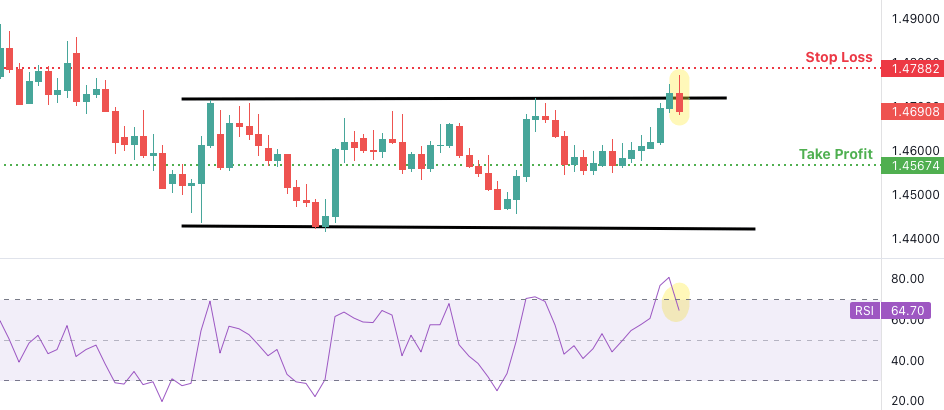
When the forex rectangle breaks upward, check to see if the RSI is in overbought territory.
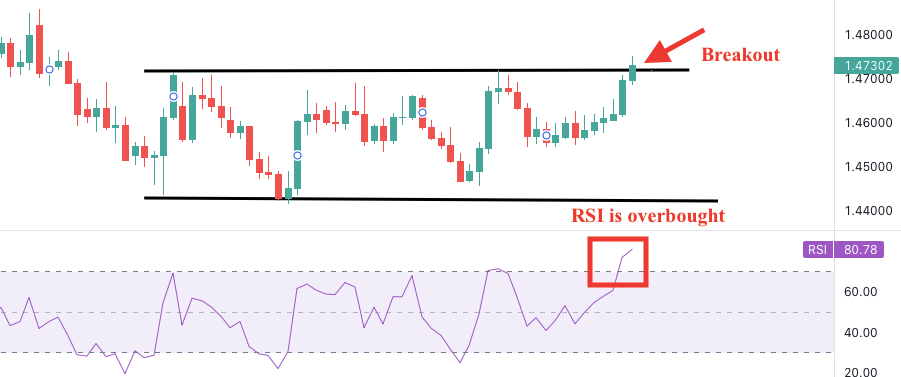
Wait for the market to reverse and the RSI to exit overbought territory (Cross 70 from above). When this occurs, sell short with a stop above the most recent high and a profit target at the bottom of the range.
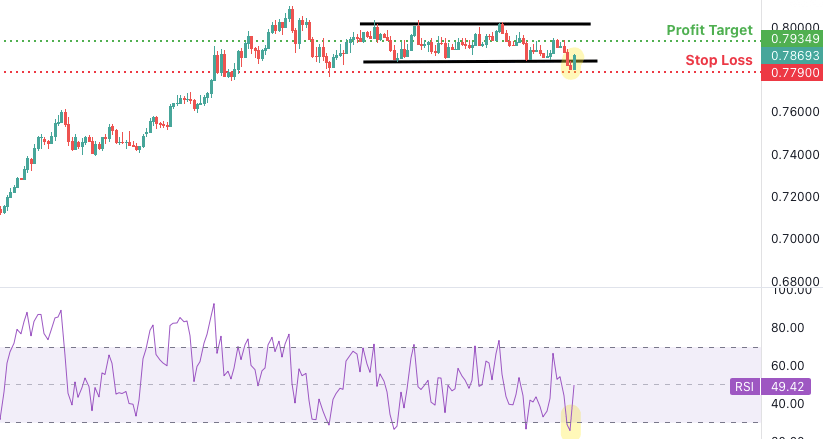
In the event of a downward break, the situation is the inverse.
Look to see if the RSI is oversold and then wait for a market reversal. When this occurs, the RSI will exit oversold territory, and you can enter a long position with a stop below the most recent low and a profit target at the top of the range.
In both cases, the trade signal is invalid if the market moved too far from the rectangle, as this is a sign of a successful breakout.
Forex Rectangle Patterns Frequently Asked Questions
The bullish rectangle is a chart pattern that forms when the price moves in a well-defined sideways range and eventually breaks out to the upside. The bullish rectangle can be a reversal or continuation pattern depending on the trend.
The bearish rectangle is a chart pattern that forms when the price moves in a well-defined sideways range and eventually breaks out to the downside. The bearish rectangle can be a reversal or continuation pattern depending on the trend.
A simple strategy is to trade the bounces within the pattern. You sell when the price reaches the top of the rectangle, and you buy when it reaches the bottom.
In an uptrend, the bearish rectangle is also called the rectangle top because it indicates that the market has reached its top and is about to reverse. Similarly, the bullish rectangle may be called the rectangle bottom in a downtrend.
Conclusion
We hope that you enjoyed this rectangle patterns forex guide.
To summarize, rectangles can be bullish and bearish.
The bullish rectangle has an upside breakout and indicates that prices will rise. The bearish rectangle has a downside breakout and indicates that prices will fall.
The bullish rectangle is a continuation pattern in an uptrend and a reversal pattern in a downtrend, where it is also called a rectangle bottom.
The bearish rectangle is a continuation pattern in a downtrend and a reversal pattern in an uptrend, where it is also called a rectangle top.
There are many strategies that you can use on rectangles. We looked at range trading, breakout trading, and a strategy for trading against breakouts.