In this guide, we’re going to discuss the Rob Booker Intraday Pivot Points indicator.
Most people have never heard of this tool, yet it is included in TradingView as a built-in indicator.
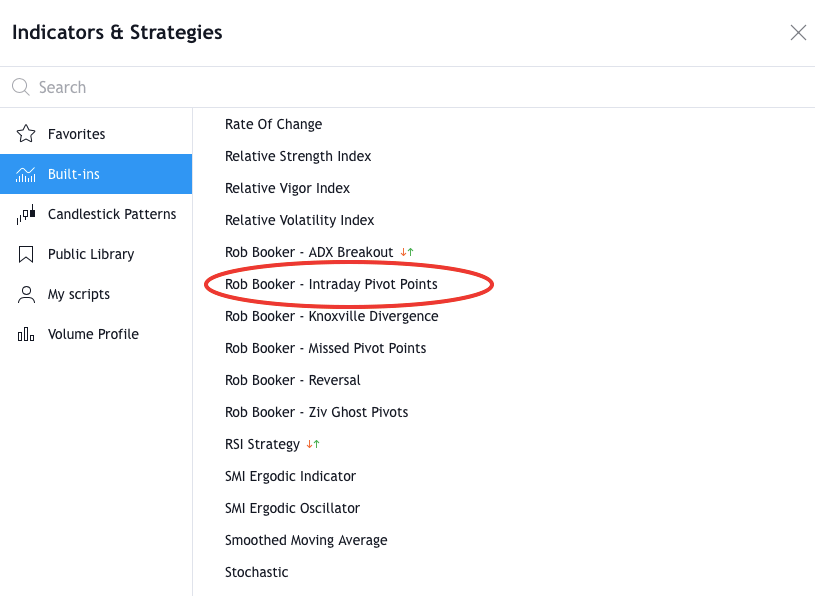
While that doesn’t mean you should use it, it’s enough to evoke some curiosity, especially if you are seeing it for the first time. We’re going to start with a brief explanation and then dive into some ideas on how you can trade with this indicator.
Our goal is to give you an overview so that you can decide whether or not it could be useful for you.
What is This Thing and How Does It Differ from the Standard Pivot Points?
Before we get started, let’s define pivots.
Pivot points are mathematically calculated support and resistance zones. Their benefit is that they sidestep the subjectivity that’s involved with identifying reversal zones manually.
Intraday pivots are pivots calculated for lower-level charts. Because these charts move rapidly, you might decide to use indicators to automatically mark important price areas. This is much easier than continuously monitoring and updating your levels by hand.
The Rob Booker Intraday Pivot Points indicator and the Standard Pivot Points indicator are both designed to help you accomplish this, but they work differently.
Standard Pivot Points Indicator
The Standard Pivot Points begin by calculating a base pivot point.
The formula for pivot points is simple: Add the “high,” “low,” and “close” prices of the previous period and divide by 3.

By default, the previous period is chosen dynamically according to the following:
- for intraday timeframes up to and including 15 min, DAY (1D) is used
- for intraday timeframes longer than 15 min, WEEK (1W) is used
- for a daily timeframe, MONTH is used (1W)
- for weekly and monthly timeframes, 12-MONTH (12M) is used
Once calculated, the base pivot point or “pivot point” is used to set further support and resistance levels through simple formulas that we will now ignore so that we don’t get too sidetracked. (See the TradingView manual if you’re interested.)
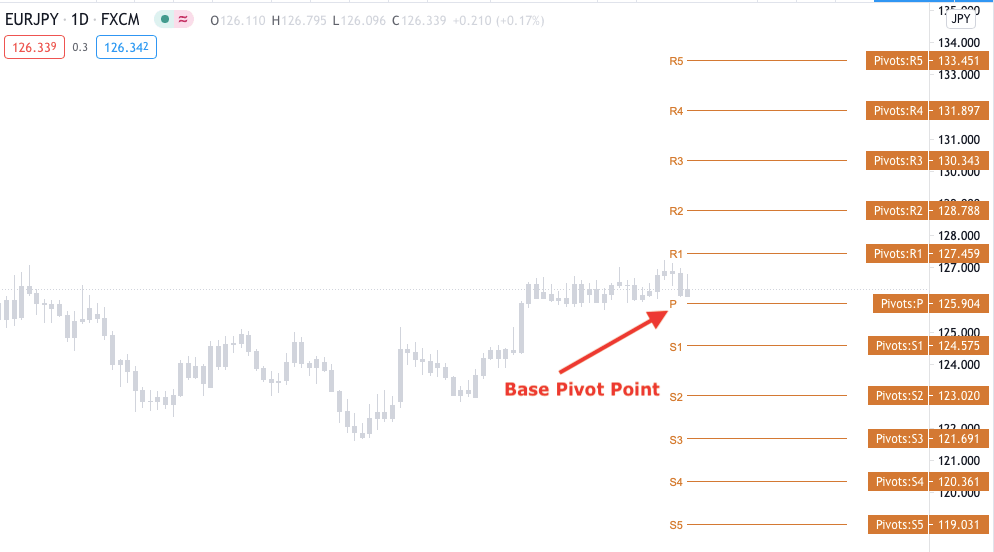
Rob Booker Intraday Pivot Points Indicator
The Rob Booker version calculates multiple pivot points, but only pivot points.
In other words, instead of calculating one pivot point and then deriving additional support and resistance areas from that, it calculates multiple pivot points, which are then used as important price areas.
These pivots are hourly, 4-hour, and 8-hour pivot as shown below:
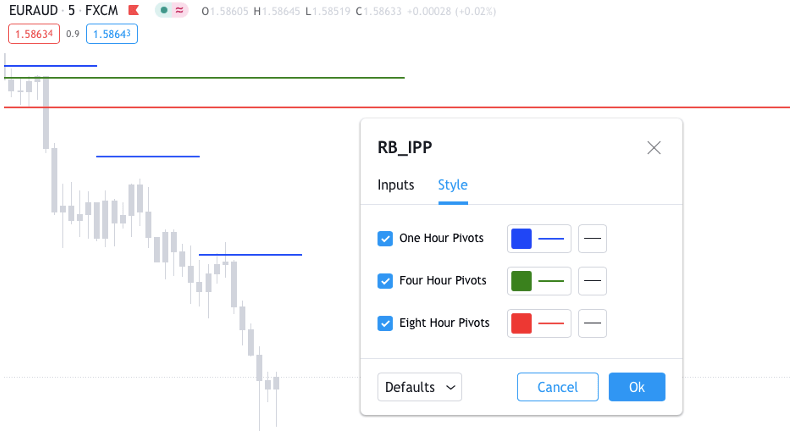
The pivot point formula remains the same; however, the previous period is much smaller compared to the standard pivot point indicator.
The lowest data range that the standard indicator uses is the daily, but this is only for 15-minute charts and below. For larger charts, it uses weekly and monthly prices.
Now, compare this with the Rob Booker indicator, which draws pivots based on intraday timeframes. In layman’s terms, the Rob Booker Intraday Pivot Points indicator is more responsive than the standard indicator because the pivots are updated more frequently.
For example, you can see that a new blue line appears every hour.
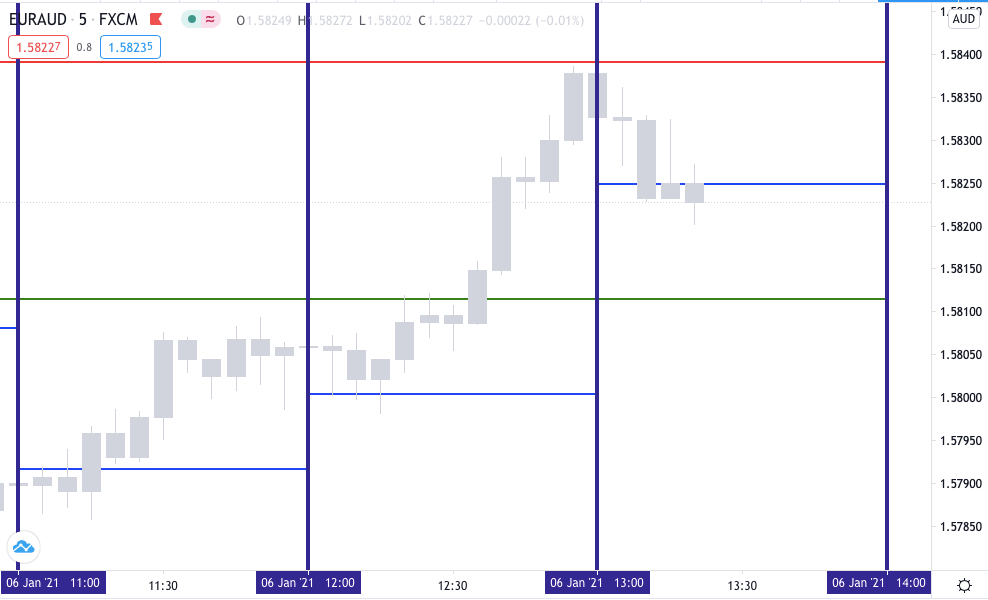
This is because the blue line represents an hourly pivot point. You can easily verify this by going to the hourly chart and performing the pivot calculation using the prior candle’s data.
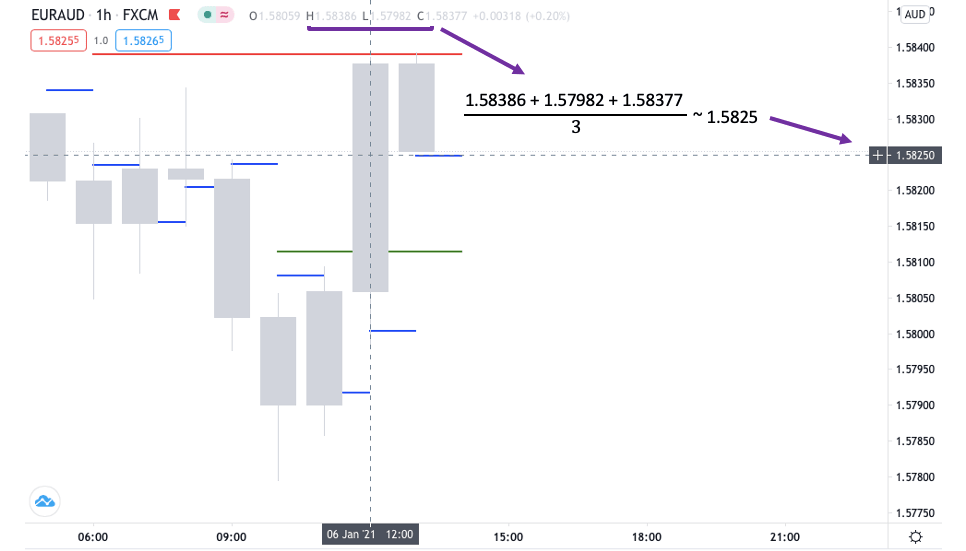
It should give you the same price where the most recent blue line is at. Similarly, new green lines appear every 4 hours and new red lines appear every 8 hours.
Now that you understand this indicator and what’s unique about it, it’s time to look at trading techniques.
Ideas on How to Trade with the Rob Booker Intraday Pivot Points Indicator
It probably doesn’t come as a surprise that this indicator is used for intraday trading.
While the 4H and H1 are technically intraday charts, it’s more suitable for the lowest charts such as the M1, M5, and M15. Especially on the 4H, the pivots will be compressed so much that you can’t really use them.
(Although it’s possible to adjust the parameters; we’ll talk about that soon.)
Let’s take a look at a few ways that you can employ this indicator. Most techniques revolve around missed pivot levels, as these are the most solid setups according to Rob Booker.
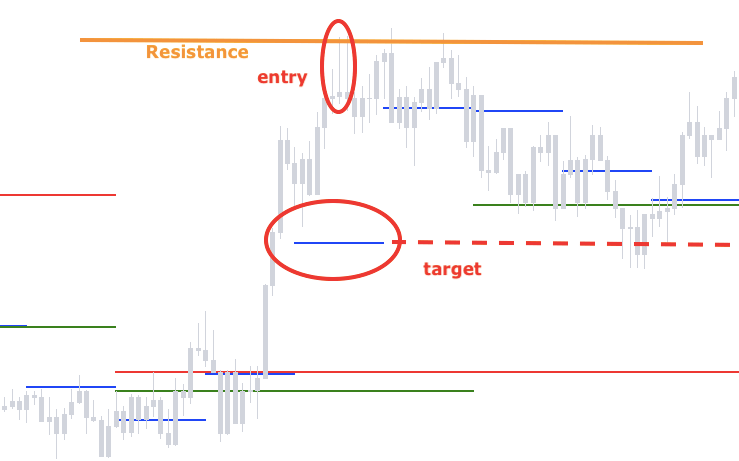
Target Missed Pivot Points for Your Take Profits
One way to use the Rob Booker Pivot Points indicator is to establish optimal profit targets.
For example, your strategy might be to trade reversal candlestick patterns at support or resistance levels. In the example below, a missed hourly pivot can provide a perfect target for a short-term scalp.
Predict Reversals with Multiple Missed Pivots
According to Rob Booker, some of the greatest trend trades occur when prices are reverting to the mean. In other words, some of the most powerful trends are financial instruments returning to missed pivot levels.
He talks about this in the video below at 25:32:
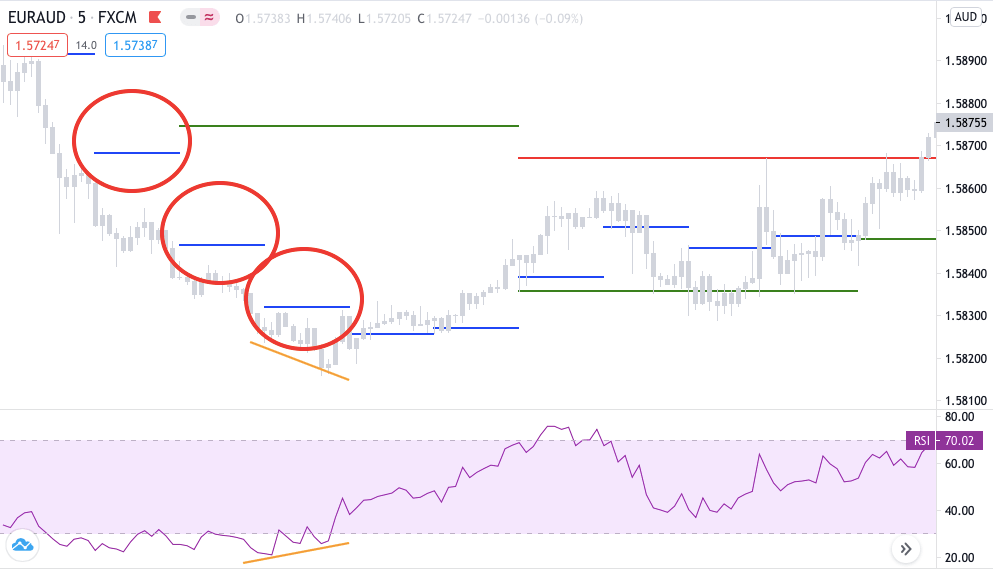
With that said, pivots that don’t get hit by price are so significant that it’s possible to build an entire trading system around them. One example could be to watch for 2 or more missed pivots in a row, followed by a reversal signal.
It’s rare for the price to miss multiple pivots in a row and it typically happens after a large and extended trend. When this is accompanied by a reversal signal, there’s a decent likelihood of a reversal.
Here’s an example:
Uncover Important Price Areas with Pivots and Fibonacci
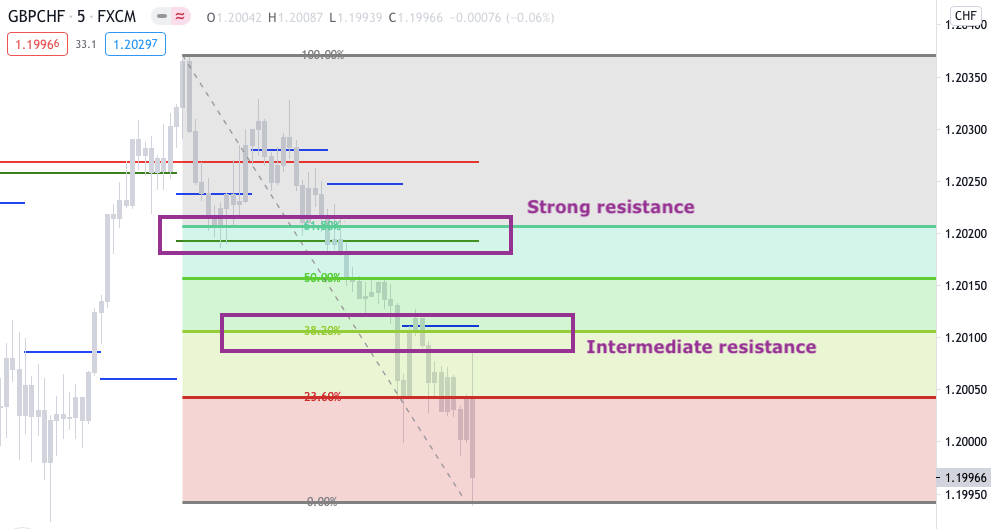
Fibonacci retracement levels paired with pivot points can help you highlight the strongest support and resistance zones.
The Fibonacci retracement levels is a popular indicator that uses horizontal lines to indicate where possible support and resistance levels are located. If you don’t know what it is, you can simply download our free cheat sheet by filling out the form below:
When drawing Fibonacci levels, you want to choose the high and low of the trend. Whenever Fibonacci levels line up with pivots, you have a reinforced price area.
Customizing the Indicator – Inputs and Style
If you double-click on either of the pivots, a window will pop up.

The first is setting the “Look Back.” It doesn’t affect the calculations; it only tells the indicator how many past days you want to keep the pivots on the chart.
Below the lookback, you can see the time periods for which the pivots are calculated. The units are in minutes, and the great thing is that you can change the numbers to show whatever intraday pivots you need.
For example, you can see that the “Period Three” pivot is set to 480 minutes, which is 8 hours.
If you wanted it to be 10 hours, you would simply type in 600 and click “OK.” The largest number that you can enter appears to be 1440, which makes sense, as this would be the daily pivot.
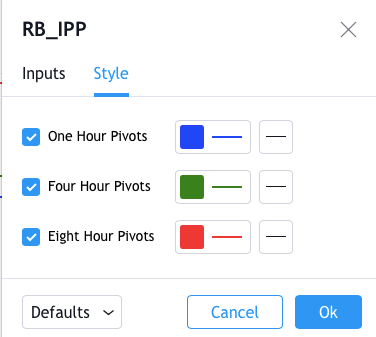
Upon switching to the style tab, you can change what the lines look like. You can also choose which pivots to show.
Conclusion
The Standard Pivot Points indicator and the Rob Booker Intraday Pivot Points indicator are not the same thing.
However, both of these indicators can be used for trading intraday. The Rob Booker version is more responsive because it uses smaller timeframes for calculating the pivot points.
This means not only that the pivots are closer to the price, but that they will be updated frequently throughout the day. Among other things, you can use them to set price targets, identify trend reversal, or uncover strong support and resistance zones.
You can also adjust the settings and choose to show pivot levels for practically any intraday timeframe.
All this can make it a great tool for any day trader, but it’s just a tool. Use it with caution and always make sure that you manage your risk and follow a trading plan.


