When it comes to making a forex strategy, we like to keep it simple.
Even though there are hundreds of different indicators, we’d much rather have a clean chart that allows us to focus on market structure and find promising trades.
Thankfully, there are tools that allow you to construct trading systems that are both easy to understand and simple to execute. The forex triangle pattern is one of those tools.
Today, we’re going to share the backtesting results of our forex triangle pattern strategy.
While this means that the strategy has only been evaluated on historical market data (no real money), the process and ideas discussed will provide tremendous value.
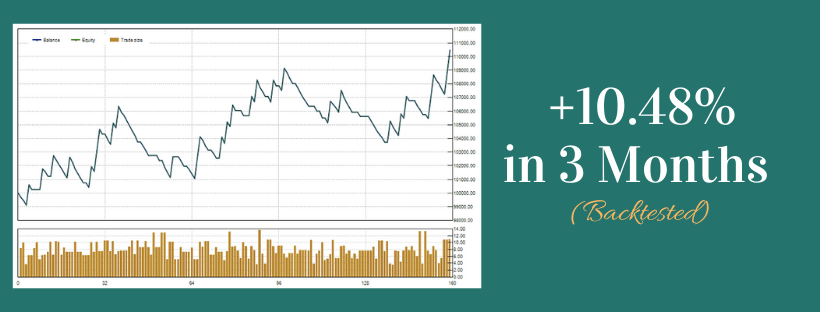
We’ll explain the initial strategy idea, show you subsequent backtesting results and discuss improvements we made. Then we will show you how backtesting the improved strategy on a different time period yielded a whopping +10.48% return in only 3 months.
Click HERE to see the strategy. Click HERE to see backtest results.
Or read the guide from top to bottom to extract the most value.
DISCLAIMER: We backtested the strategy using Soft4FX, which is our preferred backtesting tool. We might receive a commission if you purchase using our link.
Let’s get started!
What, Exactly, is a Forex Triangle Pattern?
What is a forex triangle pattern?
In simple terms, it’s a price formation that resembles a triangle.
It’s hard to give a more precise definition because there are three different versions of this pattern. Just take a look at the picture below:
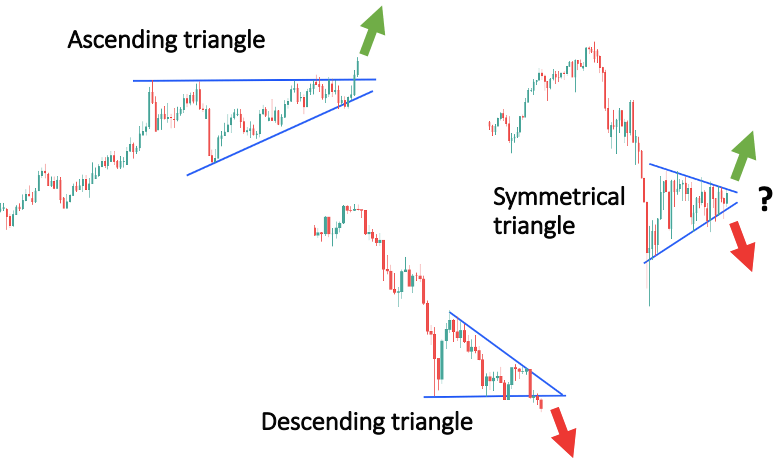
First, the ascending triangle has a horizontal top and an up-sloping bottom. This pattern forms when the market is struggling with a resistance level, but buyers appear to be stronger. Thus, the breakout direction is often up.
Of course, the resistance could also be very strong and there is not enough buying power to push it through. This happens more frequently during consolidating downtrends, but it can also happen in extended uptrends. That’s why BabyPips says that you should be ready for movement in EITHER direction.
The descending triangle is identical to the ascending triangle except the situation is reversed.
The falling market meets a sudden buying interest, and a struggle begins, where sellers appear to be stronger. They gradually suppress the price increase and often force the market back into the downtrend.
Finally, the symmetrical triangle consists of two converging trendlines and is generally considered to be an indecisive pattern. You might be thinking that this doesn’t make much since the other two triangles also involve uncertainty. And you’re right.
What’s great about symmetrical triangles is that they are a sign of volatility compression. As Adam H. Grimes puts it in his blog: “In consolidations, volatility contracts, almost as if the market is gathering energy, and then the market makes an explosive directional move.”
In other words, the usefulness of symmetrical triangles lies in their ability to foreshadow a more intense breakout compared to ascending/descending triangle predictions.
For all the different triangles, there’s an unwritten rule that you should try to catch a price move equal to at least the size of the triangle. This will also depend on the strategy used, as you’ll see in a minute.
Creating the Forex Triangle Pattern Strategy
Now that we all understand triangles, it’s time to talk about the strategy.
For a little background, we love to make different trading strategies. Creating a system that would have beaten the market in the past is an intellectual challenge on its own. Add in the possibility of future gains, and you have a hobby worth pursuing.
After spending countless hours backtesting various ideas, we noticed that triangle patterns occur quite frequently. Not only that, but it was apparent that they would often have allowed us to catch significant trends.
Seeing that, triangles seemed worth exploring.
Using this step-by-step method, we quickly put together a forex triangle pattern strategy.
Spoiler alert: It didn’t work.
That said, it was kind of expected. After all, this strategy was just a result of a quick brainstorm. We exported the data from this initial backtest into an Excel file and began looking for certain relationships.
It didn’t take long, and we made an improved version of the strategy. Backtesting this improved strategy on different price data, did, in fact, produce amazing results. That is what we’re going to show you today.
But not too fast!
Instead of merely throwing a strategy to your face, we will explain the process of making this strategy. Precisely, we’re going to show you how we came up with the initial strategy (that failed) and the subsequent improvements that led to the final strategy.
The First Version of The Strategy
We already mentioned that the reason we became interested in triangles is that they seemed to be a good fit for a trend trading system.
Since we wanted to trade as frequently as possible (not always a good idea), we decided to make a day trading strategy that catches intraday trends.
This was the idea in a nutshell:
Identify support and resistance zones on the 15-minute chart. Then, go to the 1-minute chart and look for impulse moves that penetrate these zones. Keep waiting until the price consolidates and a triangle pattern emerges. Finally, enter the market when the price breaks out of the triangle in the direction of the trend.
An ideal set-up would look something like this:
Also, there were some key rules, as listed below:
- Currency pair: EUR/USD
- Risk per trade 0.5% of the account
- Profit target: minimum 2X risk
- NO Breakeven
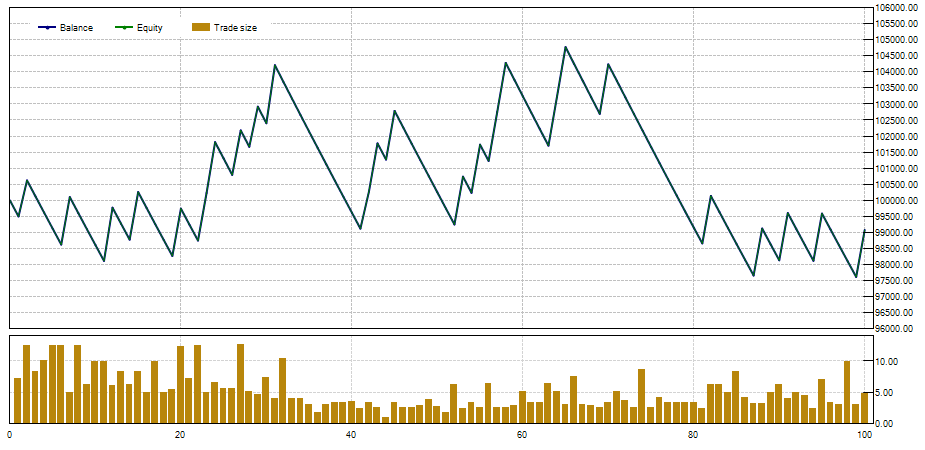
Here is what the balance curve looks like after backtesting:
And the detailed account analysis…
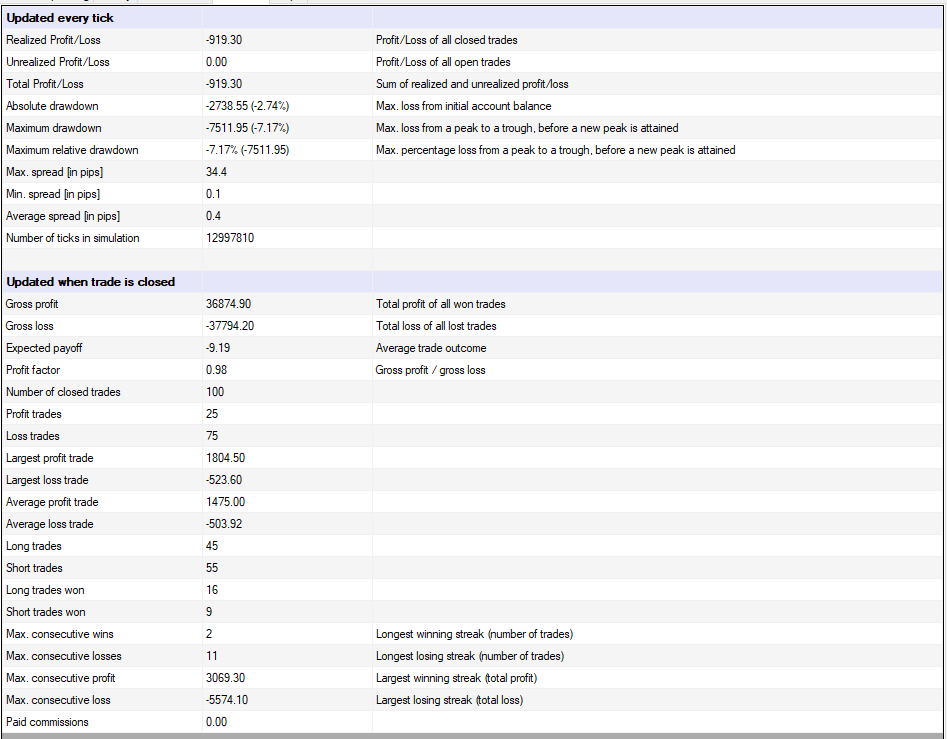
Obviously, the results aren’t spectacular. So, let’s see what we did to improve this strategy.

Learning from Backtesting and Improving the Strategy
To derive insights from the backtesting results, we exported the data into an Excel file and conducted a few simple calculations.
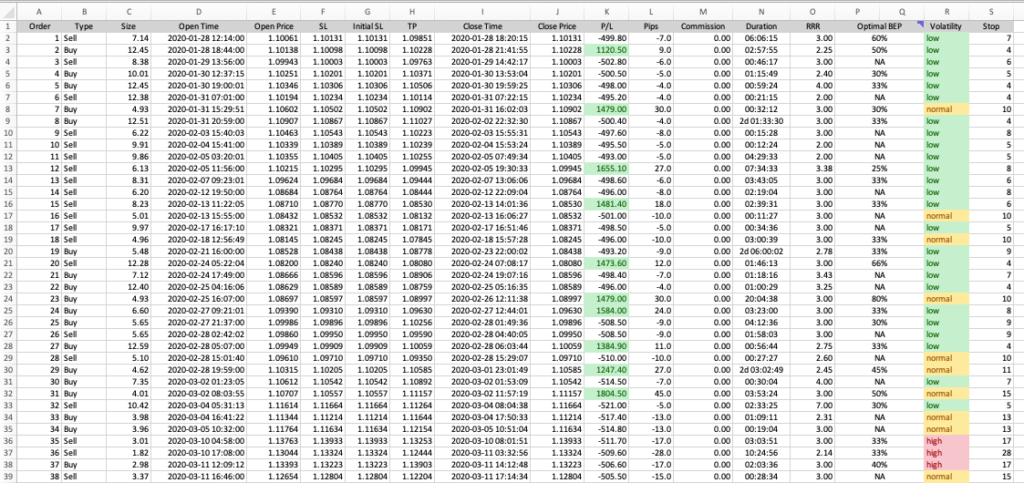
The Risk-to-Reward Ratio (RRR)
The first of these calculations is the RRR, which stand for risk-to-reward ratio. It’s a popular measurement that marks the prospective reward that you can earn for every dollar you risk on a trade.
For example, if your stop is set at 10 pips and your take profit is set at 30 pips, the RRR would be 1:3, or simply 3. Remember, our rule was a minimum RRR of 2:1, but most trades had a higher ratio in practice. Thus, including the RRR in the analysis helped see its impact on profits, especially when investigated in combination with screenshots that were taken of each trade.
This RRR is a calculated from the dataset, and you can see the formula below:
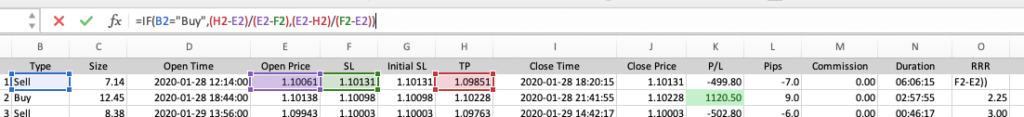
Improvement made to the strategy: We decided to fix the RRR at 1:3. This number appeared to show the best results. In trades with a higher RRR, the trend often reversed just before reaching the profit target. Trades with lower ratios did not increase the win-rate enough to offset the effect of smaller gains.
The optimal Breakeven Point (Optimal BEP)
Next, we have something called the optimal breakeven point. This is expressed as a percentage of the profit target and contrary to the RRR, it can’t be calculated in Excel.
Instead, we used our judgement.
During backtesting, we took a screenshot of each trade. At this stage, we looked at these screenshots and identified where each trade should have been set into breakeven (if, hypothetically, we did set trades into breakeven).
In a nutshell, the optimal BEP is at the smallest percentage of the profit target (TP) where we could have set the trade into breakeven and held the trade for the longest time possible thereafter before eventually reaching the profit target or being stopped out.
Don’t worry, it sounds more complicated than it actually is.
For instance, trade #8 has an optimal BEP of about 30%.
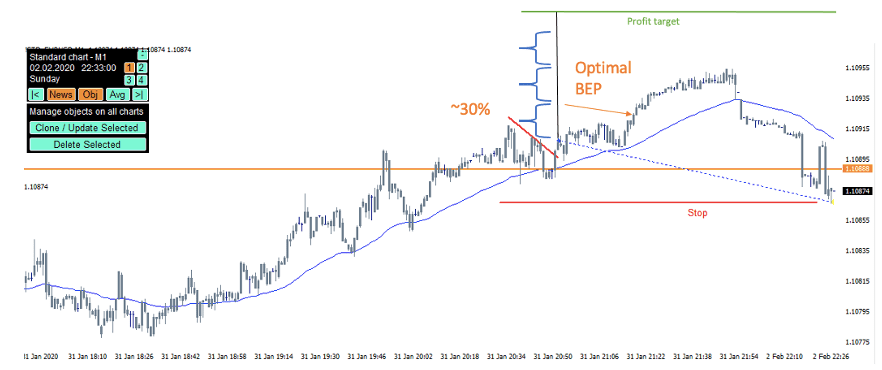
An earlier BE would have resulted in a stop out during the initial sideways movement and a later BE would have involved taking unnecessary risks. By setting the trade into BE at 30% of the TP, we would have ridden the entire upward impulse move and closed the trade at 0 when the trend changed.
Improvement made to the strategy: We decided to set every trade into breakeven upon reaching 30% of the profit target. We found that most winners at this point would have also remained winners even if we had trailed the stop to BE. The losers, on the other hand, would have frequently been BE trades instead.
Volatility and Stop Loss
The last two columns in our spreadsheet are the volatility and stop loss in pips.
Volatility is a popular measurement of risk. High volatility is often associated with large price swings in either direction, and vice versa for low volatility.
Estimating precise volatility conditions for each trade using the available data was impossible, so we decided to use the stop loss as a measurement of volatility.
Here’s how you can calculate your stop in pips from the entry and SL prices:
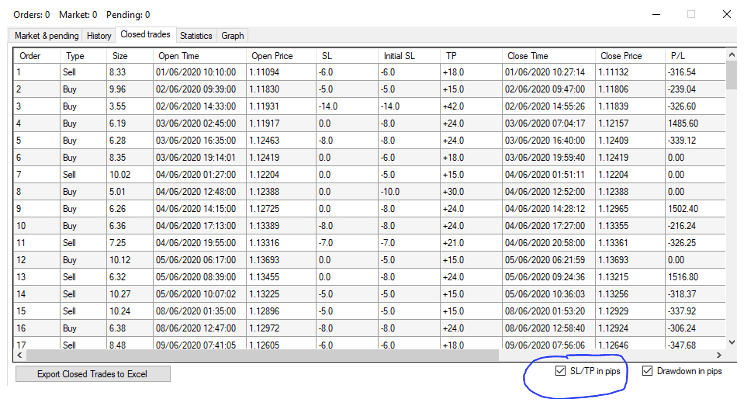
UPDATE: You can also insert the SL/TP in pips into your Excel report directly from Soft4FX. You just need to make sure to tick the box before exporting your trades:
Our stop was always placed beyond the support/resistance accompanying the triangle pattern. This way, if the stop was wide, the price swing following the breakout must have been more extensive, denoting a more volatile market.
We defined “low volatility” as stop loss <=9 pips, “medium volatility” as stop loss between 10 and 16 pips, and anything above 16 pips as “high volatility.”
Improvement made to the strategy: We expected trades with wider stops to provide better results, but the evidence was rather mixed. Thus, no additional rules were implemented.
A Few More Things
Remember establishing optimal BEPs through trade screenshots? Well, this procedure also shed light on a few more interesting things.
- Trades that went immediately against us almost always hit the stop loss.
- Trades where the consolidation phase was too long did worse
- Trades where the breakout candlestick was weak were less likely to hit the TP
And with that, we’re done!
The Forex Triangle Pattern Strategy
Let’s take a look at the final strategy, now that we’ve considered all the improvements outlined in the previous section.
Strategy Description
The goal of this strategy is to profit from small intraday trends in the EUR/USD currency pair using the one-minute chart. The strategy involves buying pullbacks following upward impulse moves and shorting bounces following downward impulse moves.
The first step of the analysis is to mark support and resistance zones on the 15-minute chart. Then, switch to the one-minute chart and wait until the price begins to exhibit a trend. This is typically characterized by accelerating price action. Keep waiting until the price breaks through a support/resistance zone and enters a consolidation.
This consolidation should resemble one of the discussed forex triangle patterns (ascending, descending, or symmetrical).
The signal occurs when the price breaks out of the triangle. This indicates that the spurt of buying/selling activity continues, and you should enter into the trend direction to ride the wave.
The Components of the Strategy
The strategy contains the following elements:
- support and resistance
- uptrend
- downtrend
- triangle
These elements are defined as follows:
Support and Resistance: Areas on the 15-minutes chart where the price turned around at least three times in the past.
Uptrend: The price is clearly heading upwards (use eyes and moving averages).
Downtrend: The price is clearly heading downwards (use eyes and moving averages).
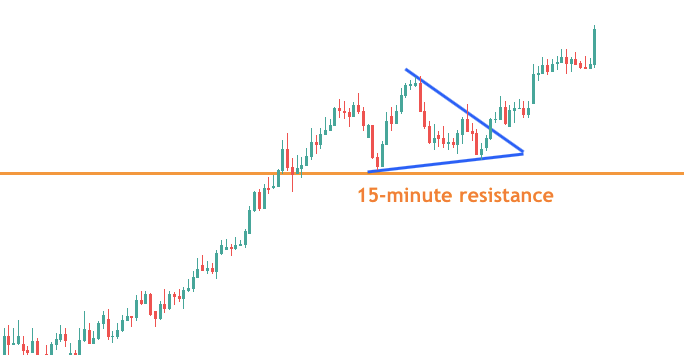
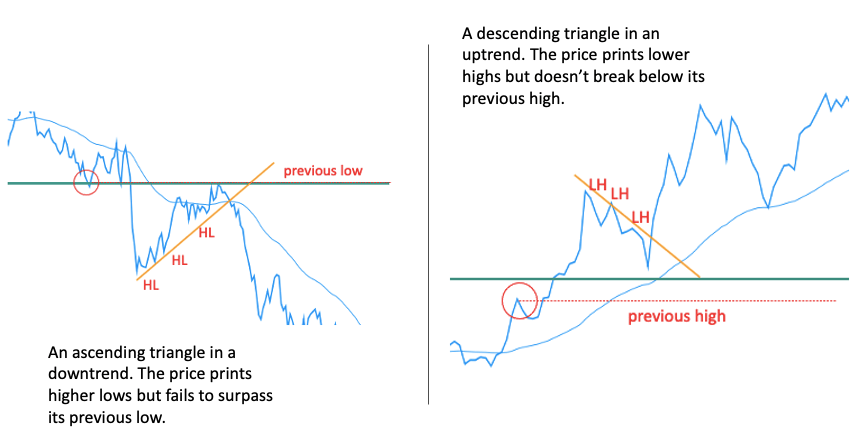
Triangle: A brief consolidation that resembles a triangle. It doesn’t matter if it is ascending, descending, or symmetrical. What’s important is that the consolidation doesn’t extend beyond the previous high/low. The example below illustrates:
Trade Signals
Long Trade | Short Trade | |
Situation | The price is trending up on the 1M chart. It reaches a 15M resistance and soon a robustious breakout occurs. Following the sharp rise, the price begins to consolidate but doesn’t fall below the previous high. This forms a forex triangle pattern. | The price is trending down on the 1M chart. It reaches a 15M support and soon a robust breakout occurs. Following the sharp decline, the price begins to consolidate but doesn’t rise above the previous low. This forms a forex triangle patter. |
Signal | The price breaks out of the forex triangle pattern to the upside with a strong bullish candle. | The price breaks out of the forex triangle pattern to the downside with a strong bearish candle. |
Restrictions
- Set-ups where the consolidation phase is too long relative to the surrounding market structures are invalid.
- Set-ups where the breakout candlestick is weak are invalid.
Exit Scenarios
Stop Loss
The stop loss must be placed slightly above or below the support or resistance, respectively.
Take Profit
Fixed 3X risk
Risk Management
- Each trade is 0.5% of the account size.
- Each trade must be set into a breakeven upon reaching 30% of the profit target.
- Each trade that immediately goes in the wrong direction must be closed about halfway through the stop loss.
Example Trades
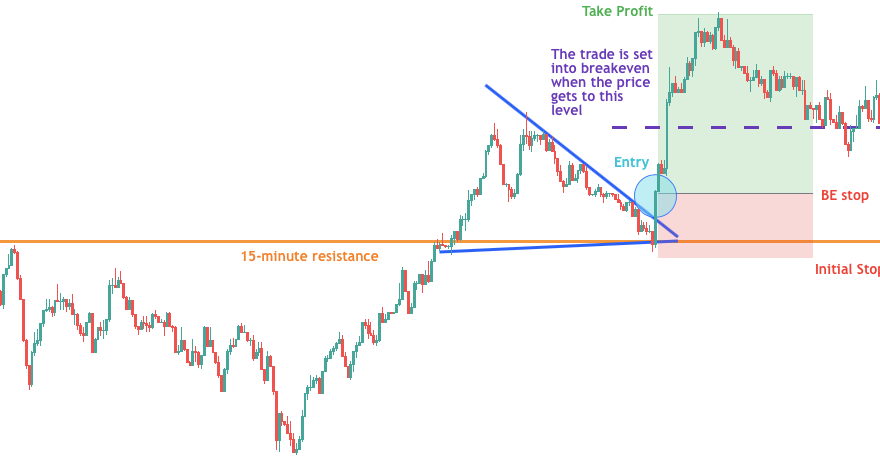
Long trade
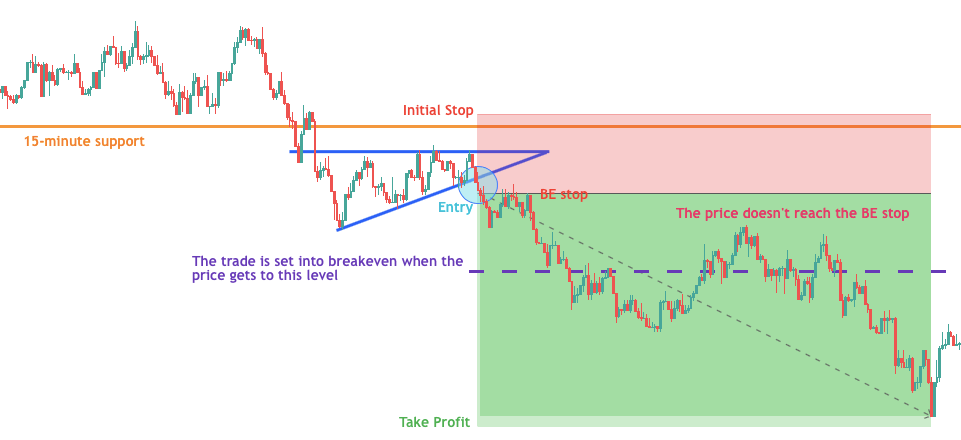
Short trade
The Strategy Results
We backtested the strategy using Soft4FX, which is our preferred backtesting tool.
In essence, Soft4FX allows you to create a paper trading account in MT4 and move back in time to any date of your choice. Then, you can begin trading your system (place, modify and close orders) as if you were trading live.
(Click here to read our guide on how to backtest with this software or check out the product page. Note that we might receive a commission if you purchase using our link.)
We had already downloaded 2020 historical market data for EUR/USD when the first version of the strategy was backtested. So, instead of starting the backtest from January, this time, we started in June to avoid backtesting twice with the same market.We used a paper trading account with a $100,000 deposit and traded until Sept 3, 2020.
Since backtesting involves simulating a past market, we could easily adjust the simulation speed and accumulate trades quickly to see the strategy’s performance.
Here is the final balance curve after 159 trades:
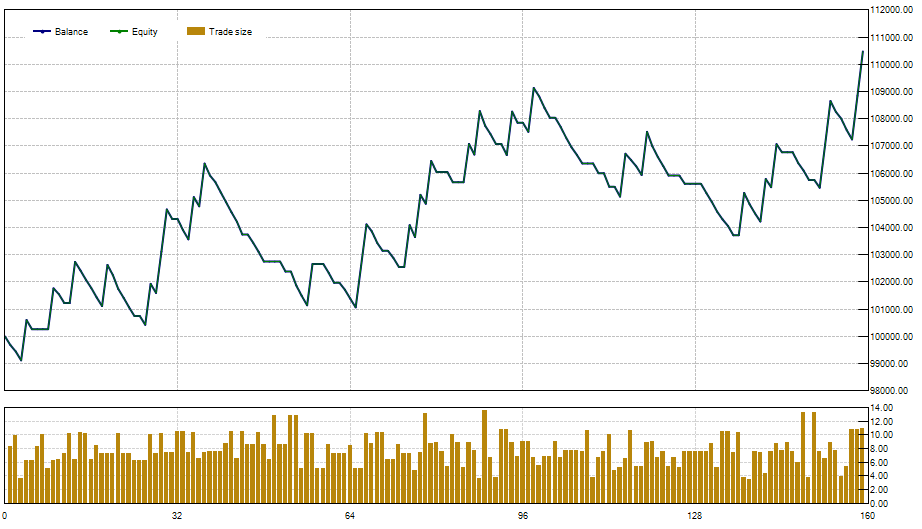
And the detailed account analysis:

At the very top of the chart, there is the realized profit/loss, which is a whopping $10,475.46 or +10.48% from the starting investment. Since we didn’t leave any open trades, this number is also the total profit produced by the forex triangle pattern strategy.
Shown below the profits are the drawdowns, both absolute and minimum. These are fairly low at -0.94% and -5.37%, respectively.
We usually ignore the absolute drawdown because it only measures the maximum loss from the initial account balance, which can be misleading. Just because the account balance didn’t fall much below the initial $100,000 deposit doesn’t mean that there were no losing streaks. It simply means that we were lucky to have them later, when the account already had some buffer.
This is evident if you look at the maximum consecutive losses, which is the 4th line item from the bottom and shows 19.
Although somewhat inflated as breakeven trades are also counted, it is still a massive number and will present a huge psychological challenge when the strategy is traded with real money.
In fact, quickly performing some elementary mathematics reveals that the win-rate of the strategy is only 17.61%. This might be intimidating if you have a hard time dealing with losses. Note, however, that there is a drastic difference between the size of the average profit trade ($1551.82) and the size of the average loss trade (-$251.72).
This, combined with the win-rate, creates an expected payoff of $65.88, making this strategy very profitable in the long-run.
Conclusion
Everyone talks about forex strategies from a “money-making” standpoint, but very few people talk about how to develop a winning trading strategy.
In this guide, you have learned how we went from wanting to make a forex triangle pattern strategy, to actually creating the strategy, and the subsequent steps we took for it to become profitable.
Despite the promising results, past results are not always indicative of future performance. We encourage you to backtest this strategy on your own to see how it works and become familiar with it.
We hope that by reading this guide, you got a glimpse of what it is like to develop a profitable trading strategy. We also hope that it helps you to unleash your creativity to make your own systems in the future.