
Forex pennant chart patterns are important in trading.
No, they’re not going to make you a million bucks, but they can help you trade trends and pull money out from the market over time.
That’s why we decided to write an in-depth guide about forex pennant patterns.
Below, you’ll find a quick table of contents so you can jump to the topic you’re most interested in.
- What is a pennant pattern in forex?
- What is a bullish pennant pattern?
- How to identify the bullish pennant pattern
- Where to put your stop loss on bullish pennant patterns
- Bullish pennant pattern target
- What is a bearish pennant pattern?
- How to identify the bearish pennant pattern
- Where to put your stop loss on bearish pennant patterns
- Bearish pennant pattern target
- What is the difference between the pennant and flag patterns?
Let’s start with what a pennant pattern is.
What is a Pennant Pattern in Forex?
The pennant pattern looks like a short triangle bounded by two converging trend lines.
It indicates trend continuation. In other words, if the market has been rising, the pennant indicates that it will continue to rise, and if it has been falling, the pennant indicates that it will continue to fall.
A picture is worth a thousand words, right? So, let’s take a look at a picture where you can see this description in action:
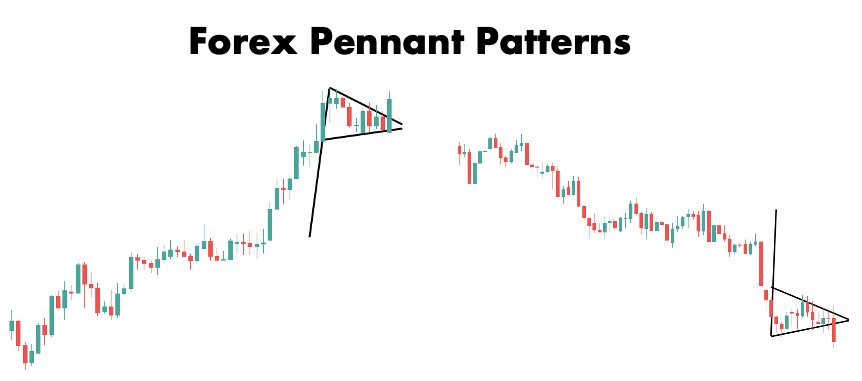
The pennant on the left-hand side is located in an uptrend while the pennant on the right-hand side is in a downtrend. In both cases, the pennant signaled a brief pause before the price resumed its previous trend.
When the preceding price action is upward, the pennant is referred to as bullish pennant because it foreshadows even higher prices.Conversely, if the pennant follows falling prices, it’s called a bearish pennant because it implies that the worst is yet to come.
We’re going to take a closer look at these two types of pennants, beginning with the bullish pennant.
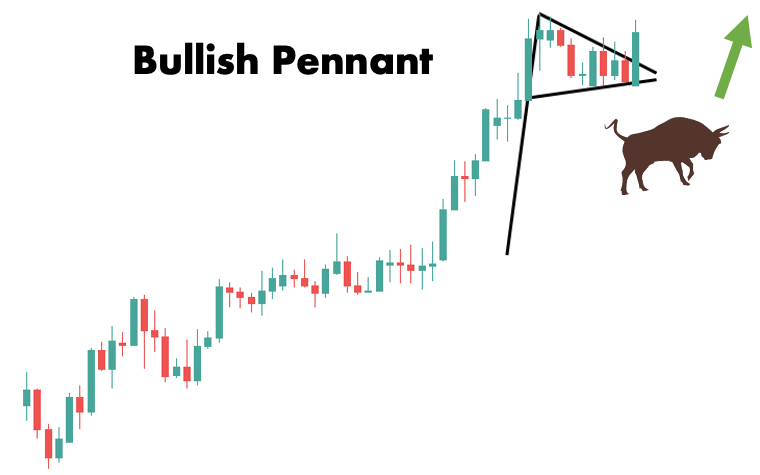
What is a Bullish Pennant Pattern?
The bullish pennant is a chart pattern that appears when the price consolidates after a large upward move and forms a tiny symmetrical triangle.
A breakout to the upside from this triangle-shaped consolidation is a signal to buy the currency pair.
Let us explain.
We know that a market needs both buyers and sellers to function. When one party is stronger than the other, a trend will develop in which the price drifts towards the path of least resistance.
In the case of an uptrend, this path of least resistance is naturally upward.
The uptrend will persist as long as a new equilibrium is reached. That is, when the imbalance between buyers and sellers is restored.
It’s important to recognize that price adjustments are gradual. They consist of big directional moves and consolidation phases.

This pattern is referred to as bullish because it foreshadows higher prices. It suggests that sellers were unable to turn the market around, and buyers are simply taking a breather before resuming the uptrend.
The terminology originates from Wall Street where an investor who bets on higher prices is referred to as “bullish.”
Now that you know what a bullish pennant pattern is, let’s learn how to identify it. We put together a quick checklist below.
How to Identify the Bullish Pennant
The formation of a bullish pennant pattern in forex involves the following steps:
- There is an uptrend leading to the pattern. You want to see the market printing several bullish candles with little to no retracement.
- Once the large price movement subsides, a period of consolidation begins.
- The consolidation phase is shaped like a pennant. This happens when the price makes lower highs and higher lows within a narrowing range.
- The bullish pennant pattern is completed when there is a breakout from the pattern to the upside. Only then should you consider taking a position in the currency pair.
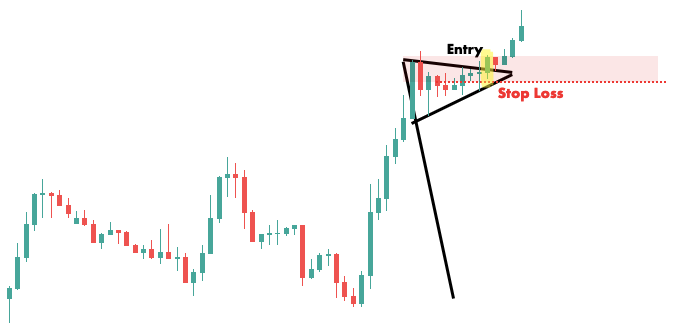
The chart below provides an excellent opportunity to review the identification guidelines. The bullish pennant pattern is clear with the price action narrowing over time until a green candle eventually closes outside the pennant.
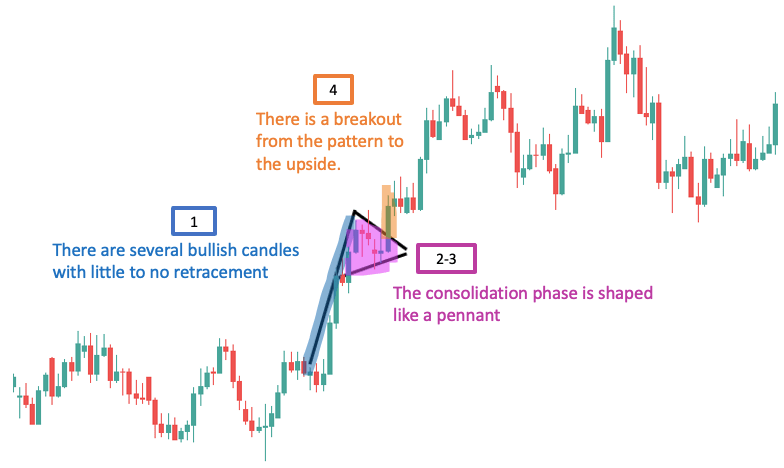
Notice how the market continued to reach higher and higher prices after the bullish pennant hinted that the cooling trend may be ready to reignite.
Keep reading if you’re interested in looking at trading techniques and more examples of the bullish pennant forex pattern.
Where to Put Your Stop Loss on Bullish Pennant Patterns
One of the first questions that comes to mind when planning a bullish pennant trade is that of the stop loss.
A stop loss is simply an order you place with your broker to close your position if it moves against you by a predetermined amount.
An obvious place for your stop loss is just below the pennant. This will allow you to play the pattern and quickly get out if the market reverses.
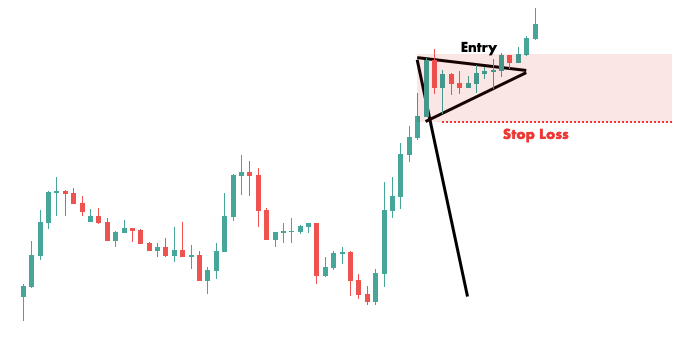
The size of the pennant is an important factor to consider. If the pennant is very small, you may want to add a few more pips to your stop loss to avoid being stopped out by a random price swing.
If you want to stay in the position for a longer time, you might also just place your stop below the most recent support level. You will have to use a smaller position size, but you will also be less likely to get stopped out.
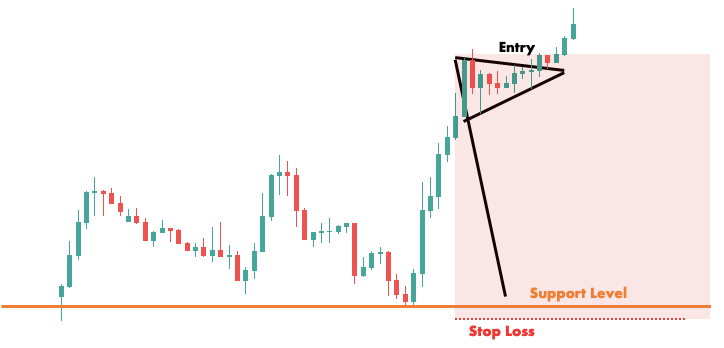
On the flip side, if you want to be really aggressive you can use the bottom of the breakout candle as your stop loss level.
This technique can be ideal for a scalping strategy because it allows you to maximize your leverage and squeeze the most money out of each pip movement.
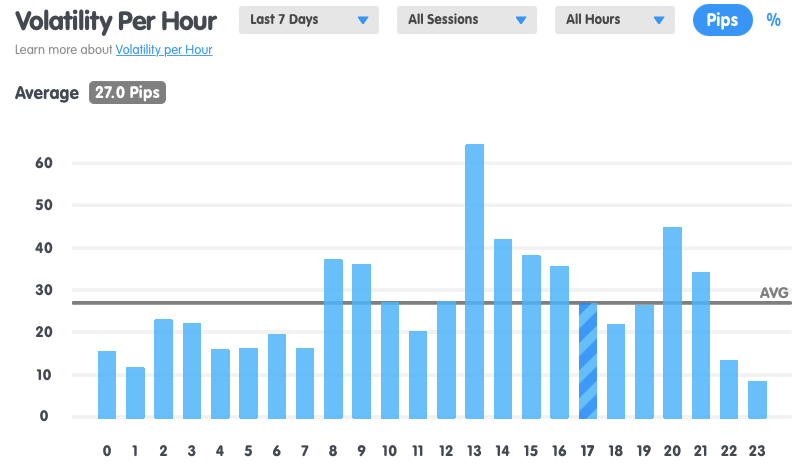
Another popular method is setting the stop loss based on market volatility. This means you check the average market movement on your timeframe and set your stop loss at a multiple of that figure.
There’s a handy volatility calculator on BabyPips that you can use for this purpose.
For example, the screenshots above are taken from the hourly GBP/USD chart. This pair has an average hourly pip fluctuation of 27 pips according to BabyPips.
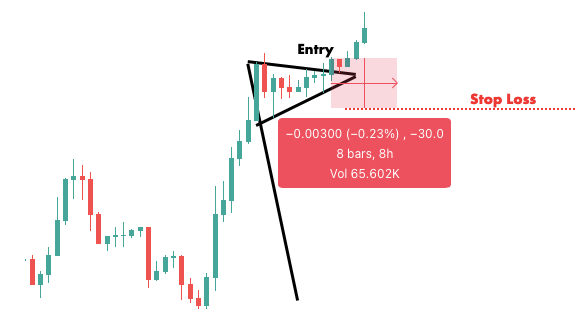
This guide belongs to ForexSpringBoard.com. Do not copy.
You can see that th stop loss is located 30 pips below the entry price to take into account market volatility.

Bullish Pennant Pattern Target
After ensuring that your risk on the trade is at a minimum, the next logical step is to maximize your profit potential.
To that end, let’s take a look at a few possibilities for the bullish pennant pattern target price.
One advantage of chart patterns like the pennant is that they provide a “built-in” price target. This is sometimes called the measure rule.
The way it works is very straightforward.
Simply take the difference between the top of the pennant and the flagpole low. Add this value to the low of the breakout candlestick at the pennant end to get the price target.
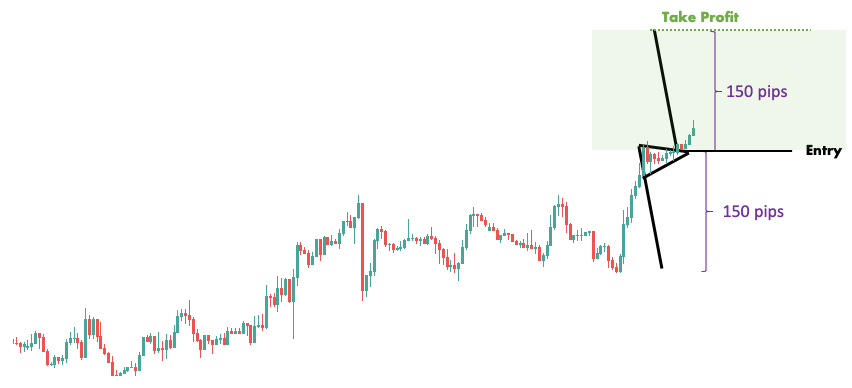
This strategy is especially useful for traders trying to lock in a quick profit because the profit objective set this way will be fairly close to the entry price.
Another popular method is to target the closest resistance level.
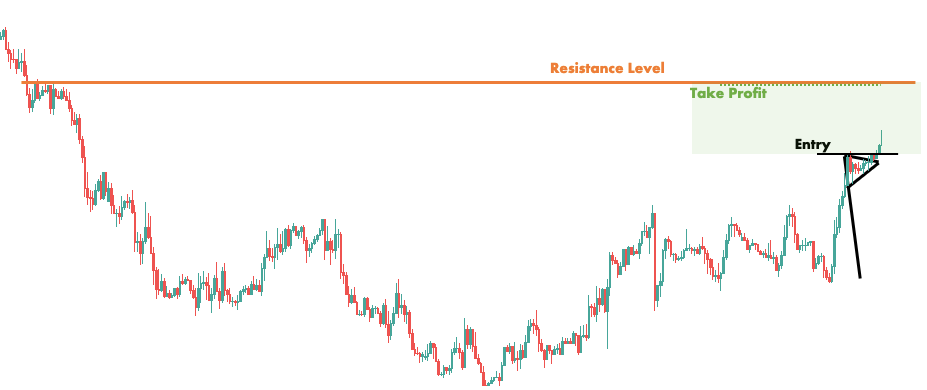
Note that if the resistance is close, the risk-reward aspects of the trade may be unfavorable, and you should probably pass until a better opportunity presents itself.
Some traders use a fixed ratio to get around the problem of insufficient risk-reward. For example, they could use a strategy we covered earlier to calculate their stop loss, and then set their profit objective to 2x, 3x, or 5x the risked amount.
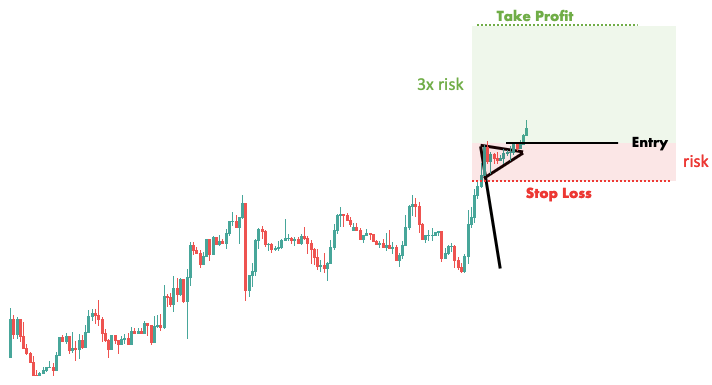
This has the advantage of simplicity, but it overlooks the market structure, which might occasionally backfire.
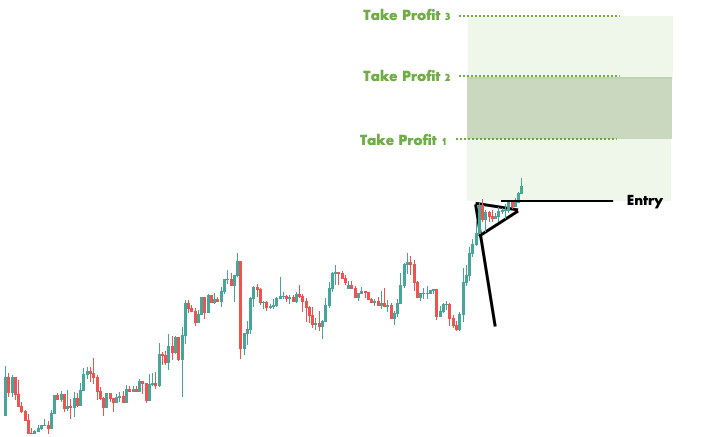
It’s worth mentioning that not all traders use one profit target. You might set multiple profit targets based on different prices. Here, taking profits is done in a methodical manner, with X percent of your position closed each time the market reaches one of your targets.
Besides, some traders choose not to set profit targets at all. They let the market decide when they take profit. If you find this approach sympathetic you might wait for a reversal chart pattern as a trigger for closing your trade.
Now that you know how to read a bullish forex pennant pattern, it’s time to learn how to read a bearish one.
What Is a Bearish Pennant Pattern?
If the bullish pennant is considered “the pennant,” the bearish pennant is a reverse pennant pattern.
The bearish pennant is a chart pattern that appears when the price consolidates after a large downward move and forms a tiny symmetrical triangle.
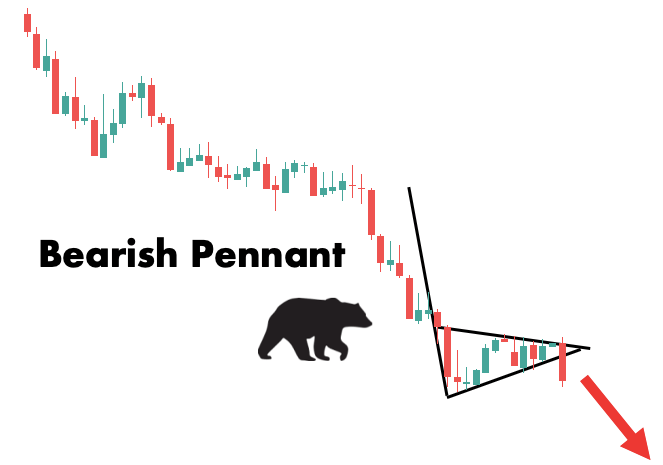
A breakout to the downside from this triangle-shaped consolidation is a signal to sell the currency pair.
We already highlighted that a market needs both buyers and sellers to function. It is the imbalance between the power of buyers and sellers that gives rise to trading opportunities.
Unlike the bullish pennant, the bearish pennant forms in a downtrend, meaning that sellers overwhelm buyers.
This also means that prices will fall until a new equilibrium is found. That is, once the buyer-seller balance has been restored.

The bearish pennant is an excellent chart pattern that represents situations just like that.
After a significant price drop, the subsequent consolidation forms a triangle that can be identified by two converging trend lines.
The combination of the drop and the triangle resembles a pennant on a flagpole, hence the name. It is referred to as a bearish pennant because it predicts lower prices, much like those pessimistic Wall Street investors known as bears.
How to Identify the Bearish Pennant
The following steps are involved in the formation of a bearish pennant pattern in forex:
- The pattern is preceded by a downward trend. The market should print several bearish candles with little to no pullback.
- A period of consolidation begins once the large price movement has subsided.
- The consolidation phase has a pennant-like shape. This happens when the price makes lower highs and higher lows in a narrowing range.
- The bearish pennant pattern is completed when there is a downside breakout from the pattern. Only then should you consider trading the currency pair.
The chart below is a great way to go over the identification guidelines again. The bearish pennant pattern is clearly visible, with price action narrowing over time until a red candle closes outside the pennant.
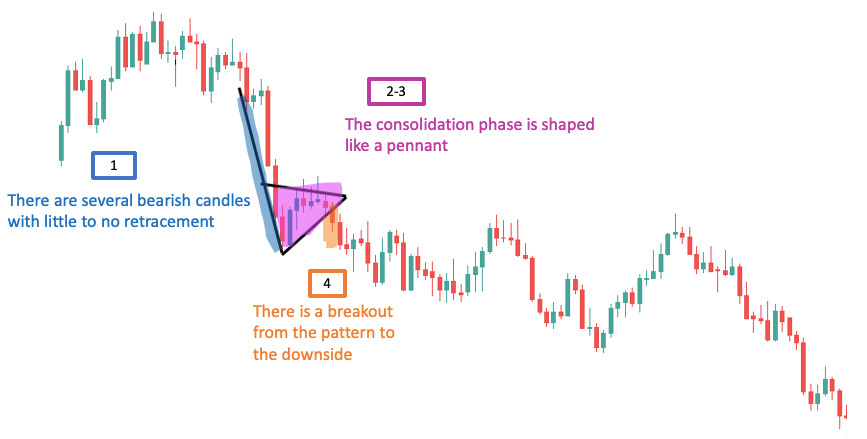
Take note of how the market continued to fall after the bearish pennant signaled that the cooling trend was about to resume.
Continue reading if you want to learn more about trading techniques and see more examples of the bearish pennant forex pattern.
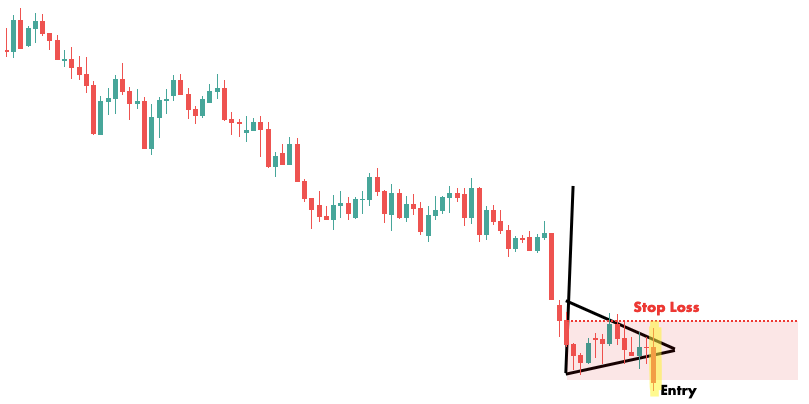
Where to Put Your Stop Loss on Bearish Pennant Patterns
When planning a bearish pennant trade, or any other trade for that matter, risk management should always be at the forefront of your mind.
Since the stop loss is one of the most effective risk management tools, it’s natural to want to know where to put it in case of a bearish pennant trade.
A general rule of thumb is to put your stop loss just above the pennant. This will enable you to trade the pattern while exiting swiftly if the market reverses.
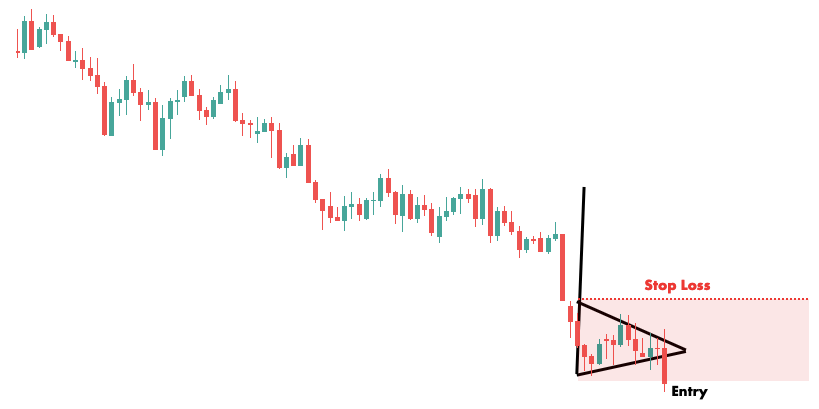
As previously stated, the size of the pennant is critical because small patterns will have the stop loss too close to the entry price, resulting in frequent stop outs.
You might counter this by adding a few pips of additional buffer to your stop.
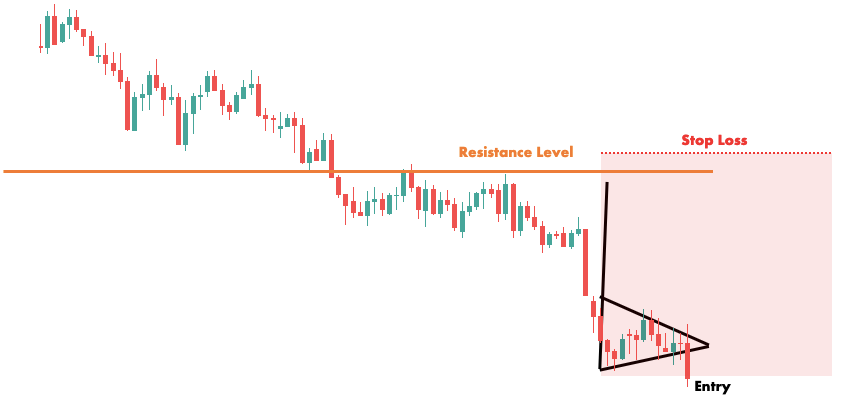
If you want to stay in the position for a longer period of time, you can simply set your stop above the most recent resistance level. You’ll need to use a smaller position size, but you’ll be less likely to get stopped out.
On the other hand, if you want to be really aggressive, you can set your stop loss at the top of the breakout candle. This technique can be ideal for a scalping strategy because it allows you to open a large position size and amplify the value of each pip movement.
Last but not least, in the bullish pennant section, we mentioned using volatility for stop placement. This technique also works for the bearish pennant forex pattern.
Bearish Pennant Pattern Target
Risk management is important, but so is planning for a successful exit. So, let’s look at a few different target prices for the bearish pennant formation.
To begin, the bearish pennant pattern also comes with a “built-in” target price that you can easily uncover using the previously introduced measure rule.
It works like this:
Simply take the difference between the bottom of the pennant and the flagpole high. Subtract this value from the high of the breakout candlestick at the pennant end to get the target price.
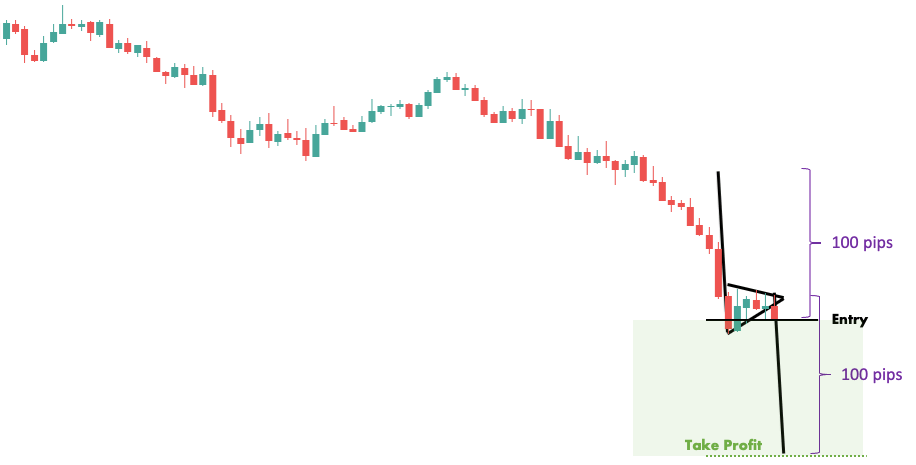
This can be an ideal day trading strategy because the profit objective will be relatively close to the entry price.
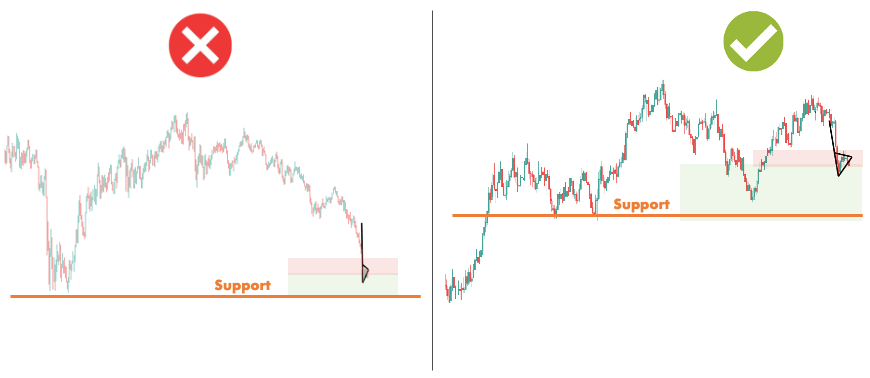
Another popular technique involves aiming for the closest support level. However, be aware that this may result in unfavorable risk-reward ratios. In this case, it is best to wait until a better opportunity arises.
You may also find it appealing to use a fixed risk-reward ratio, which is another popular technique for setting the target price for the bearish pennant pattern.
This might involve shooting for 3x your risked amount like we did with our triangle pattern trading strategy.
(By the way, if you’re interested in developing trading strategies, you should definitely read that article.)
In case you prefer to take partial profits, another excellent technique is to set multiple profit targets based on different prices. As the price moves in your favor, you gradually close out portions of your position as illustrated below:
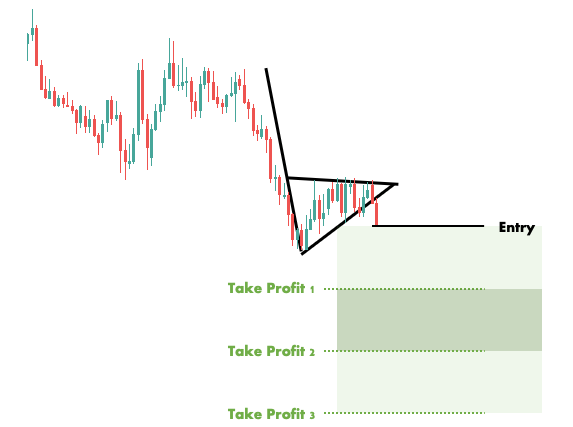
Finally, if you want complete flexibility, you can use no profit targets at all. Instead, hold the position as long as possible and only exit if the trend appears to be preparing to reverse.
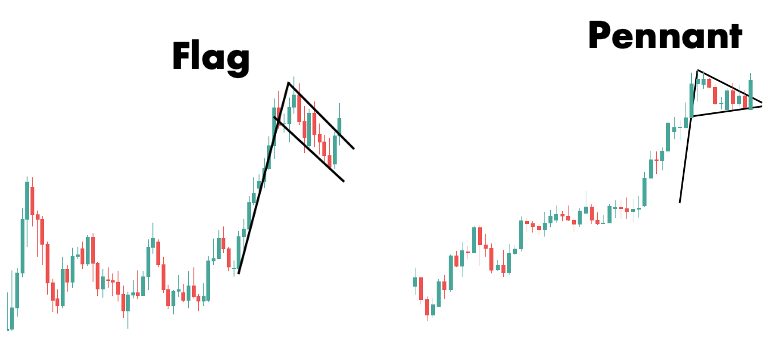
What Is the Difference Between the Pennant and Flag Patterns?
The difference is in the form of the consolidation. Instead of two parallel trend lines, the pennant pattern is bounded by two converging trend lines.
Aside from that, pennant and flag patterns are the same in that they both indicate a temporary exhaustion before the market resumes its trend.
The oblique implication of this distinction is that, in the case of the pennant, the market exerts a less intense effort to reverse the trend.
While knowing these nuances is useful, don’t overthink it. The key is to understand what market condition causes these formations. It makes little difference whether a pattern is technically a pennant or a flag.
In any case, patterns are subjective, so what you might call a pennant may be interpreted as a flag by another trader.
The important thing to remember is that formations like pennants, flags, and wedges appear when volatility is compressed. This indicates a decrease in market activity, which is frequently a sign that the market is taking a breather before continuing on its previous trend.
Forex Pennant Patterns Frequently Asked Questions
Forex pennant patterns are continuation patterns. They form on a chart when the price makes a large up or down move and then consolidates between two converging trend lines. The end of the consolidation is usually followed by the continuation of the preceding trend.
The bullish pennant is a chart pattern that appears when the price consolidates after a large upward move and forms a tiny symmetrical triangle. A breakout to the upside from this triangle-shaped consolidation is a signal to buy the currency pair.
In the case of a bullish pennant, bet on higher prices. To protect against a sudden price drop, set the stop loss below the pennant. In the case of a bearish pennant, bet on lower prices. To protect against a sudden price jump, set the stop loss above the pennant.
The difference is in the form of the consolidation. Instead of two parallel trend lines, the pennant pattern is bounded by two converging trend lines. Aside from that, pennant and flag patterns are the same in that they both indicate a temporary exhaustion before the market resumes its trend.
Conclusion
We hope this guide gave you a good overview of forex pennant chart patterns.
If you are still unsure about certain aspects of these formations, send us a message and we will respond as soon as possible and do our best to help you.
If you find this guide useful, please share it on social media so that other traders can benefit from it as well.